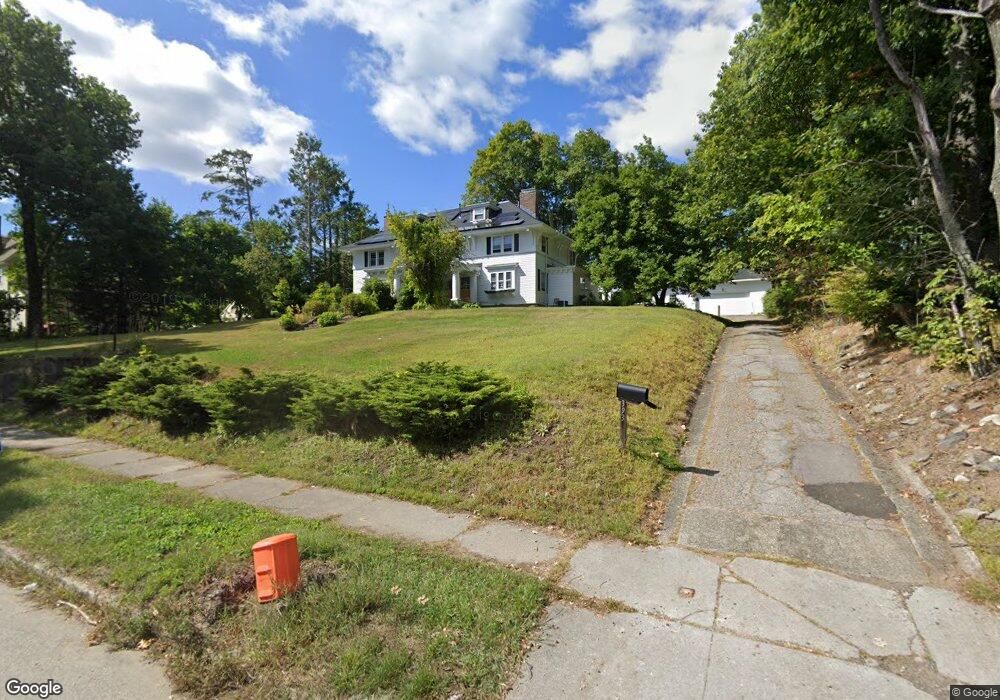
393 May St Worcester, MA 01602
Tatnuck NeighborhoodEstimated Value: $563,000 - $819,000
5
Beds
3
Baths
3,625
Sq Ft
$195/Sq Ft
Est. Value
About This Home
This home is located at 393 May St, Worcester, MA 01602 and is currently estimated at $706,923, approximately $195 per square foot. 393 May St is a home located in Worcester County with nearby schools including Chandler Magnet, Tatnuck Magnet School, and Jacob Hiatt Magnet School.
Ownership History
Date
Name
Owned For
Owner Type
Purchase Details
Closed on
Mar 29, 2019
Sold by
Wells Fargo Bank Na Tr
Bought by
Luarasi-Zguro Eglantina and Zguro Ilir
Current Estimated Value
Home Financials for this Owner
Home Financials are based on the most recent Mortgage that was taken out on this home.
Original Mortgage
$165,000
Outstanding Balance
$145,064
Interest Rate
4.3%
Mortgage Type
New Conventional
Estimated Equity
$561,859
Purchase Details
Closed on
Mar 5, 2018
Sold by
Oconnell Mary A
Bought by
Wells Fargo Bank Na Tr
Create a Home Valuation Report for This Property
The Home Valuation Report is an in-depth analysis detailing your home's value as well as a comparison with similar homes in the area
Home Values in the Area
Average Home Value in this Area
Purchase History
| Date | Buyer | Sale Price | Title Company |
|---|---|---|---|
| Luarasi-Zguro Eglantina | $290,849 | -- | |
| Wells Fargo Bank Na Tr | $361,000 | -- |
Source: Public Records
Mortgage History
| Date | Status | Borrower | Loan Amount |
|---|---|---|---|
| Open | Luarasi-Zguro Eglantina | $165,000 |
Source: Public Records
Tax History
| Year | Tax Paid | Tax Assessment Tax Assessment Total Assessment is a certain percentage of the fair market value that is determined by local assessors to be the total taxable value of land and additions on the property. | Land | Improvement |
|---|---|---|---|---|
| 2025 | $9,233 | $700,000 | $119,800 | $580,200 |
| 2024 | $8,977 | $652,900 | $119,800 | $533,100 |
| 2023 | $8,716 | $607,800 | $104,200 | $503,600 |
| 2022 | $8,166 | $536,900 | $83,400 | $453,500 |
| 2021 | $8,119 | $498,700 | $66,800 | $431,900 |
| 2020 | $7,555 | $444,400 | $66,700 | $377,700 |
| 2019 | $7,621 | $423,400 | $60,400 | $363,000 |
| 2018 | $7,541 | $398,800 | $60,400 | $338,400 |
| 2017 | $7,538 | $392,200 | $60,400 | $331,800 |
| 2016 | $7,768 | $376,900 | $45,900 | $331,000 |
| 2015 | $7,564 | $376,900 | $45,900 | $331,000 |
| 2014 | $7,365 | $376,900 | $45,900 | $331,000 |
Source: Public Records
Map
Nearby Homes
- 1 Ashmore Rd
- 35 Iowa St
- 51 Brantwood Rd
- 1 Kenilworth Rd
- 109 S Flagg St
- 10 Wrentham Rd Unit 308
- 860 Pleasant St
- 31 Lenox St
- 543 Chandler St
- 4 Chamberlain Pkwy
- 1066 Pleasant St
- 61 Richmond Ave
- 42 Wrentham Rd
- 87 Moreland St
- 14 Saint Elmo Rd
- 12 Sherwood Rd
- 80 Vassar St
- 618 Mill St
- 30 Kinnicutt Rd
- 28 Saxon Rd
Your Personal Tour Guide
Ask me questions while you tour the home.