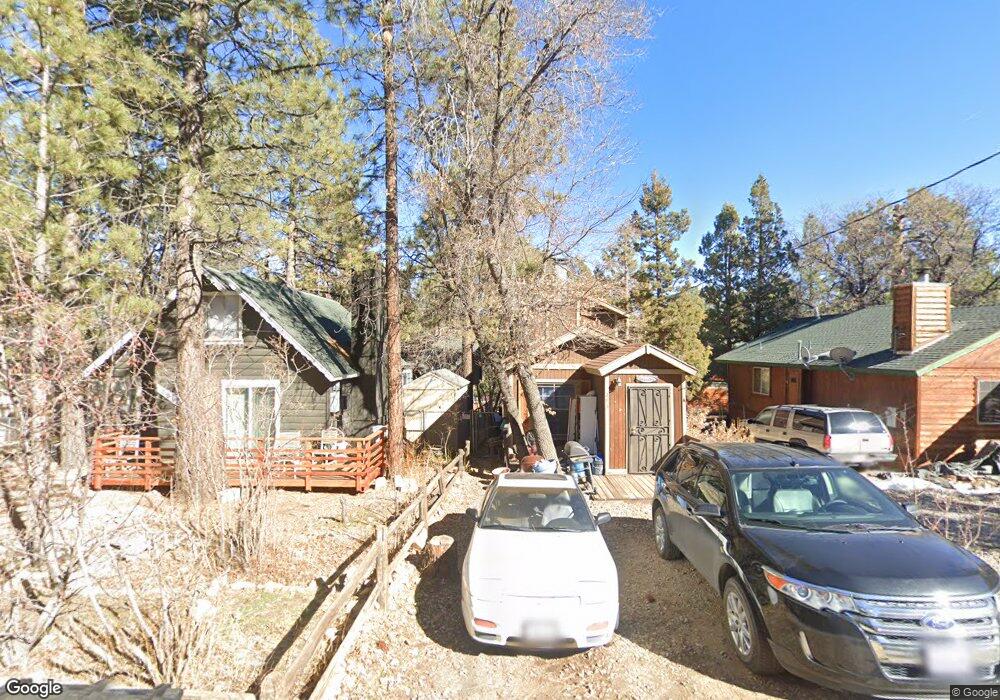
393 Spruce Ln Sugarloaf, CA 92386
Estimated Value: $233,682 - $256,000
1
Bed
1
Bath
699
Sq Ft
$354/Sq Ft
Est. Value
About This Home
This home is located at 393 Spruce Ln, Sugarloaf, CA 92386 and is currently estimated at $247,171, approximately $353 per square foot. 393 Spruce Ln is a home with nearby schools including Baldwin Lane Elementary School, Big Bear Middle School, and Big Bear High School.
Ownership History
Date
Name
Owned For
Owner Type
Purchase Details
Closed on
Aug 17, 2015
Sold by
Urban Christopher A and Irvine Edmund J
Bought by
Meyer Kevin
Current Estimated Value
Home Financials for this Owner
Home Financials are based on the most recent Mortgage that was taken out on this home.
Original Mortgage
$80,300
Outstanding Balance
$63,198
Interest Rate
4.05%
Mortgage Type
New Conventional
Estimated Equity
$183,973
Purchase Details
Closed on
Nov 9, 2014
Sold by
Thien Gloria U
Bought by
Irvine Edmund J
Purchase Details
Closed on
Dec 19, 2013
Sold by
Urban Christopher A
Bought by
Urban Christopher A and Thiel Gloria C
Purchase Details
Closed on
Apr 30, 2012
Sold by
Urban Ernest S and Urban Ruth E
Bought by
Urban Ernest S and Urban Ruth E
Purchase Details
Closed on
Jan 22, 2005
Sold by
Urban Ernest S and Urban Ruth E
Bought by
Urban Ernest S and Urban Ruth E
Create a Home Valuation Report for This Property
The Home Valuation Report is an in-depth analysis detailing your home's value as well as a comparison with similar homes in the area
Home Values in the Area
Average Home Value in this Area
Purchase History
| Date | Buyer | Sale Price | Title Company |
|---|---|---|---|
| Meyer Kevin | $85,000 | Wfg Title Company Of Ca | |
| Irvine Edmund J | -- | Ticor Title | |
| Urban Christopher A | -- | None Available | |
| Urban Ernest S | -- | None Available | |
| Urban Ernest S | -- | -- | |
| Urban Ernest S | -- | -- |
Source: Public Records
Mortgage History
| Date | Status | Borrower | Loan Amount |
|---|---|---|---|
| Open | Meyer Kevin | $80,300 |
Source: Public Records
Tax History Compared to Growth
Tax History
| Year | Tax Paid | Tax Assessment Tax Assessment Total Assessment is a certain percentage of the fair market value that is determined by local assessors to be the total taxable value of land and additions on the property. | Land | Improvement |
|---|---|---|---|---|
| 2025 | $2,311 | $100,622 | $23,674 | $76,948 |
| 2024 | $2,311 | $98,649 | $23,210 | $75,439 |
| 2023 | $2,219 | $96,715 | $22,755 | $73,960 |
| 2022 | $2,117 | $94,819 | $22,309 | $72,510 |
| 2021 | $2,063 | $92,960 | $21,872 | $71,088 |
| 2020 | $2,044 | $92,007 | $21,648 | $70,359 |
| 2019 | $1,997 | $90,203 | $21,224 | $68,979 |
| 2018 | $1,919 | $88,434 | $20,808 | $67,626 |
| 2017 | $1,861 | $86,700 | $20,400 | $66,300 |
| 2016 | $1,812 | $85,000 | $20,000 | $65,000 |
| 2015 | $1,224 | $32,343 | $2,431 | $29,912 |
| 2014 | $1,199 | $31,709 | $2,383 | $29,326 |
Source: Public Records
Map
Nearby Homes
- 351 Pine Ln
- 317 Spruce Ln
- 497 Cedar Ln
- 331 Maple Ln
- 428 Maple Ln
- 316 Cedar Ln
- 2088 Manzanita Ln
- 0 Spruce Ln Unit IG25167820
- 0 Spruce Ln Unit IG25167795
- 0 Spruce Ln Unit 32501912
- 0 Spruce Ln Unit 32501909
- 525 Pine Ln
- 267 Spruce Ln
- 370 Victoria Ln
- 854 Cedar Ln
- 298 Maple Ln
- 531 Maple Ln
- 550 Pine Ln
- 249 Cedar Ln
- 435 Moreno Ln