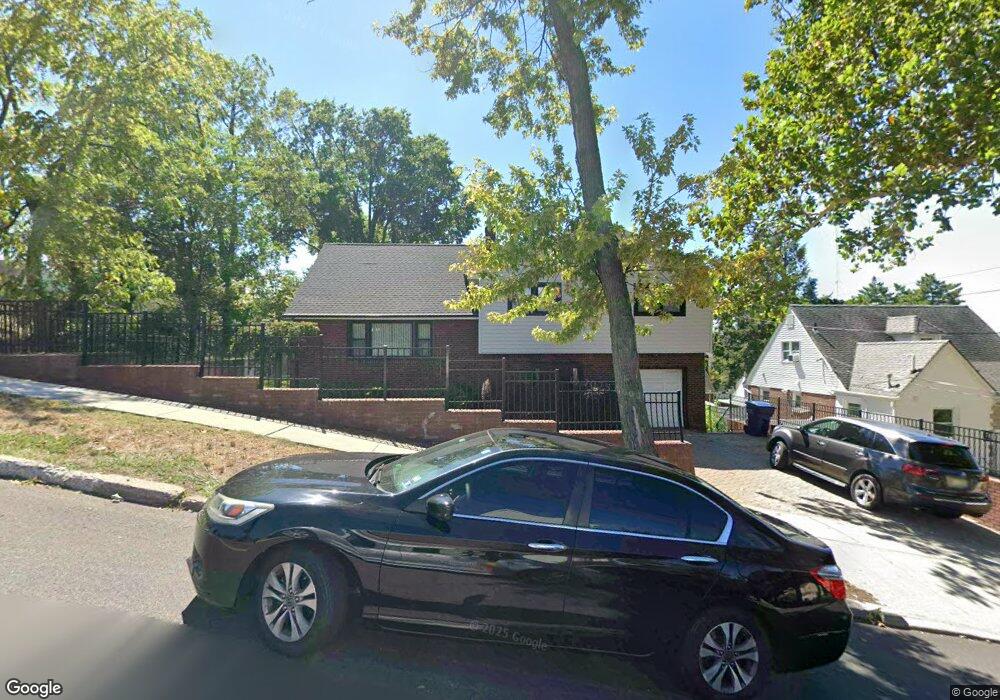
393 Sutton Ave Hackensack, NJ 07601
Estimated Value: $622,000 - $863,000
Studio
--
Bath
2,161
Sq Ft
$329/Sq Ft
Est. Value
About This Home
This home is located at 393 Sutton Ave, Hackensack, NJ 07601 and is currently estimated at $710,079, approximately $328 per square foot. 393 Sutton Ave is a home located in Bergen County with nearby schools including Hackensack High School and Corpus Christi School.
Ownership History
Date
Name
Owned For
Owner Type
Purchase Details
Closed on
Nov 27, 2000
Sold by
Ripalda Oscar
Bought by
Onwuchekwa Ngozi
Current Estimated Value
Home Financials for this Owner
Home Financials are based on the most recent Mortgage that was taken out on this home.
Original Mortgage
$180,000
Outstanding Balance
$66,332
Interest Rate
7.7%
Mortgage Type
Purchase Money Mortgage
Estimated Equity
$643,747
Create a Home Valuation Report for This Property
The Home Valuation Report is an in-depth analysis detailing your home's value as well as a comparison with similar homes in the area
Home Values in the Area
Average Home Value in this Area
Purchase History
| Date | Buyer | Sale Price | Title Company |
|---|---|---|---|
| Onwuchekwa Ngozi | $225,000 | -- |
Source: Public Records
Mortgage History
| Date | Status | Borrower | Loan Amount |
|---|---|---|---|
| Open | Onwuchekwa Ngozi | $180,000 |
Source: Public Records
Tax History
| Year | Tax Paid | Tax Assessment Tax Assessment Total Assessment is a certain percentage of the fair market value that is determined by local assessors to be the total taxable value of land and additions on the property. | Land | Improvement |
|---|---|---|---|---|
| 2025 | $13,067 | $427,600 | $203,100 | $224,500 |
| 2024 | $12,311 | $427,600 | $203,100 | $224,500 |
| 2023 | $11,539 | $427,600 | $203,100 | $224,500 |
| 2022 | $11,539 | $411,800 | $186,400 | $225,400 |
| 2021 | $11,363 | $338,400 | $157,000 | $181,400 |
| 2020 | $11,198 | $338,400 | $157,000 | $181,400 |
| 2019 | $10,987 | $327,300 | $154,500 | $172,800 |
| 2018 | $11,075 | $324,500 | $152,000 | $172,500 |
| 2017 | $10,942 | $320,400 | $149,500 | $170,900 |
| 2016 | $10,428 | $308,700 | $139,500 | $169,200 |
| 2015 | $10,262 | $293,200 | $161,400 | $131,800 |
| 2014 | $9,740 | $293,200 | $161,400 | $131,800 |
Source: Public Records
Map
Nearby Homes
- 448 Sutton Ave
- 311 Marvin Ave
- 115 Polifly Rd Unit 5D
- 90 Prospect Ave Unit 2A
- 90 Prospect Ave Unit 9B
- 54 Polifly Rd Unit 201
- 301 Beech St Unit 10I
- 301 Beech St Unit 2B
- 353 Beech St
- 279 Clark St Unit A-7
- 125 Prospect Ave Unit 17G
- 125 Prospect Ave Unit 16C
- 125 Prospect Ave Unit 8D
- 73 Macarthur Ave
- 151 S Prospect Ave Unit 9D
- 151 S Prospect Ave Unit 19 A
- 151 S Prospect Ave Unit 18A
- 151 S Prospect Ave Unit 16D
- 150 Overlook Ave Unit 10H
- 150 Overlook Ave Unit 7F
- 397 Sutton Ave
- 396 Marvin Ave
- 392 Marvin Ave
- 402 Marvin Ave
- 401 Sutton Ave
- 385 Sutton Ave
- 75 S Summit Ave
- 406 Marvin Ave
- 405 Sutton Ave
- 404 Sutton Ave
- 410 Marvin Ave
- 408 Sutton Ave
- 381 Sutton Ave
- 69 S Summit Ave
- 382 Marvin Ave
- 411 Sutton Ave
- 414 Marvin Ave
- 412 Sutton Ave
- 380 Sutton Ave
- 375 Sutton Ave
Your Personal Tour Guide
Ask me questions while you tour the home.