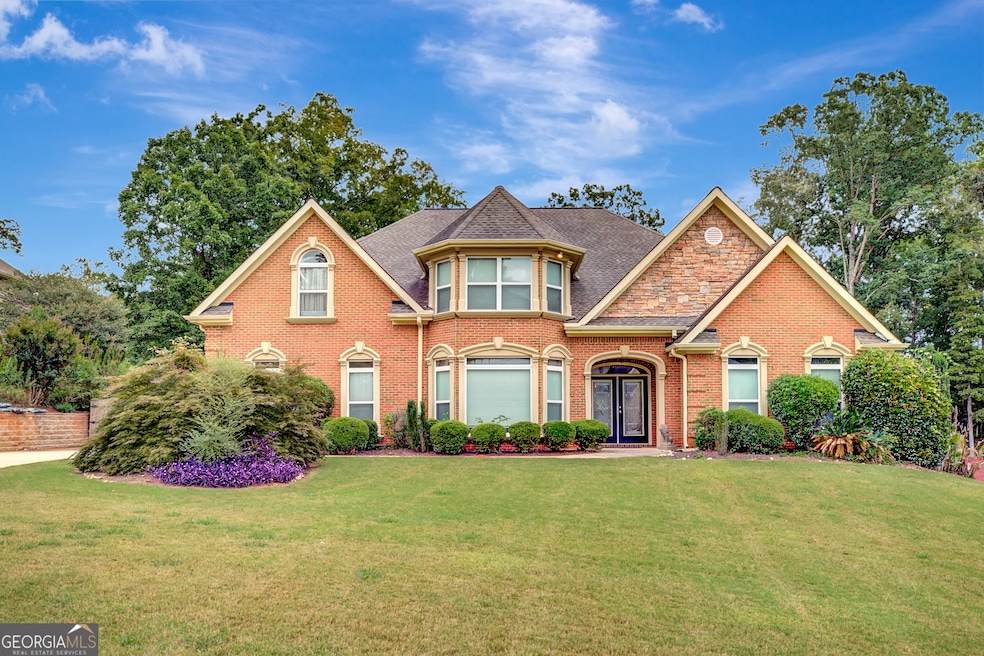
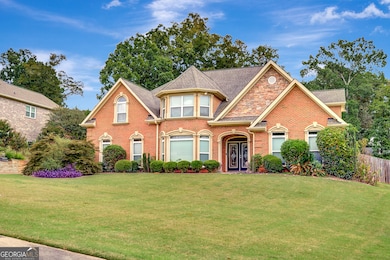
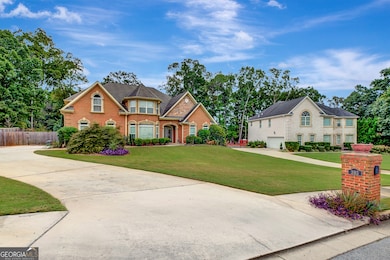
393 Young James Cir Stockbridge, GA 30281
Estimated payment $3,619/month
Highlights
- Heated In Ground Pool
- French Provincial Architecture
- Vaulted Ceiling
- Dining Room Seats More Than Twelve
- Private Lot
- Wood Flooring
About This Home
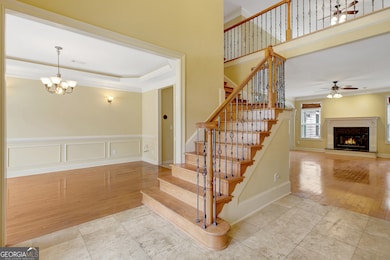
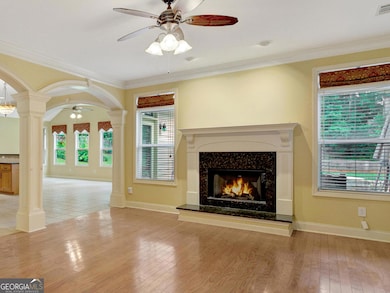
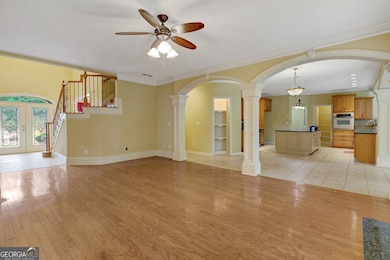
Elegant European-Inspired Retreat with Pool in a Hidden Gem Neighborhood! Welcome to this stunning European-inspired home, tucked away in one of the area's best-kept secret neighborhoods! It is intimate, inviting, and lined with sidewalks perfect for evening strolls. Step inside to a grand two-story foyer with a beautifully designed staircase that sets the tone for the open, airy floor plan. Just beyond, you'll find a spacious family room featuring a cozy fireplace and large windows that fill the space with natural light. The chef's kitchen is the heart of the home - complete with a center island, gas cooktop, dishwasher, expansive counter space, and a huge breakfast bar perfect for casual dining. A walk-in pantry and convenient laundry room are just steps away. Behind the kitchen, a bright and cheerful keeping room surrounded by windows creates an ideal space for relaxing or entertaining. Down the hall, a powder room and custom shelving lead to a formal dining room that's ready for your finishing touch. The butler's pantry connections are already in place! The main-level Owner's Suite is a private haven with elegant columns defining the space and offering endless design options. The spa-like ensuite bath includes dual vanities, a soaking tub, a walk-in shower, and dual closets for ample storage. Upstairs, a spacious loft overlooks the foyer - perfect for a home office, media room, or creative space. You'll also find four additional bedrooms and two full baths, offering plenty of room for comfort and flexibility. Throughout the home, you'll appreciate the no-carpet design with stylish, low-maintenance flooring running seamlessly throughout. And now for the showstopper....the backyard oasis! The heated pool, less than 7 years old and meticulously maintained year-round, is the centerpiece of your private retreat. Surrounded by a large fenced yard, it's the ultimate space for cookouts, celebrations, and making memories. This home truly has it all-elegance, functionality, and the perfect setting for entertaining. Come experience it for yourself! Your next chapter begins here!
Listing Agent
Keller Williams Realty Atl. Partners License #266690 Listed on: 10/24/2025

Home Details
Home Type
- Single Family
Est. Annual Taxes
- $8,570
Year Built
- Built in 2005
Lot Details
- Private Lot
- Level Lot
Parking
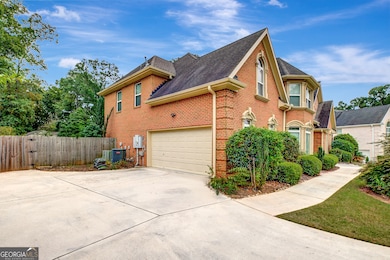
- Garage
Home Design
- French Provincial Architecture
- European Architecture
- Slab Foundation
- Composition Roof
- Three Sided Brick Exterior Elevation
Interior Spaces
- 4,180 Sq Ft Home
- 2-Story Property
- Vaulted Ceiling
- Ceiling Fan
- Two Story Entrance Foyer
- Family Room with Fireplace
- Dining Room Seats More Than Twelve
- Formal Dining Room
- Loft
- Sun or Florida Room
- Wood Flooring
- Pull Down Stairs to Attic
- Laundry Room
Kitchen
- Breakfast Area or Nook
- Walk-In Pantry
- Double Oven
- Microwave
- Dishwasher
- Kitchen Island
Bedrooms and Bathrooms
- 5 Bedrooms | 1 Primary Bedroom on Main
- Walk-In Closet
- Double Vanity
- Soaking Tub
- Bathtub Includes Tile Surround
- Separate Shower
Outdoor Features
- Heated In Ground Pool
- Patio
Schools
- Cotton Indian Elementary School
- Austin Road Middle School
- Stockbridge High School
Utilities
- Forced Air Zoned Heating and Cooling System
- Dual Heating Fuel
- Heating System Uses Natural Gas
- Underground Utilities
- Gas Water Heater
- Septic Tank
- High Speed Internet
- Phone Available
- Cable TV Available
Community Details
Overview
- Property has a Home Owners Association
- Association fees include ground maintenance
- James Crossing Subdivision
Amenities
- Laundry Facilities
Map
Home Values in the Area
Average Home Value in this Area
Tax History
| Year | Tax Paid | Tax Assessment Tax Assessment Total Assessment is a certain percentage of the fair market value that is determined by local assessors to be the total taxable value of land and additions on the property. | Land | Improvement |
|---|---|---|---|---|
| 2025 | $6,622 | $216,920 | $24,000 | $192,920 |
| 2024 | $6,622 | $205,360 | $24,000 | $181,360 |
| 2023 | $6,134 | $211,600 | $22,000 | $189,600 |
| 2022 | $5,295 | $154,640 | $16,000 | $138,640 |
| 2021 | $4,744 | $134,000 | $16,000 | $118,000 |
| 2020 | $4,730 | $133,440 | $12,000 | $121,440 |
| 2019 | $4,499 | $115,200 | $11,520 | $103,680 |
| 2018 | $3,769 | $96,180 | $10,580 | $85,600 |
| 2016 | $3,617 | $99,280 | $10,000 | $89,280 |
| 2015 | $3,537 | $94,720 | $9,000 | $85,720 |
| 2014 | $3,273 | $87,160 | $9,000 | $78,160 |
Property History
| Date | Event | Price | List to Sale | Price per Sq Ft |
|---|---|---|---|---|
| 10/24/2025 10/24/25 | For Sale | $550,000 | -- | $132 / Sq Ft |
Purchase History
| Date | Type | Sale Price | Title Company |
|---|---|---|---|
| Warranty Deed | $288,000 | -- | |
| Warranty Deed | $240,450 | -- | |
| Special Warranty Deed | $332,075 | -- | |
| Foreclosure Deed | $332,075 | -- | |
| Deed | $369,900 | -- |
Mortgage History
| Date | Status | Loan Amount | Loan Type |
|---|---|---|---|
| Open | $230,400 | New Conventional | |
| Previous Owner | $55,500 | New Conventional |
Source: Georgia MLS
MLS Number: 10631172
APN: 046H-01-116-000
Disclaimer: Certain information contained herein is derived from information provided by parties other than Homes.com. All information provided is deemed reliable, but is not guaranteed to be accurate and should be independently verified.
![]() The data relating to real estate for sale on this web site comes in part from the Broker Reciprocity Program of Georgia MLS. Real estate listings held by brokerage firms other than Redfin are marked with the Broker Reciprocity logo and detailed information about them includes the name of the listing brokers. Information deemed reliable but not guaranteed. Copyright 2025 Georgia MLS. All rights reserved.
The data relating to real estate for sale on this web site comes in part from the Broker Reciprocity Program of Georgia MLS. Real estate listings held by brokerage firms other than Redfin are marked with the Broker Reciprocity logo and detailed information about them includes the name of the listing brokers. Information deemed reliable but not guaranteed. Copyright 2025 Georgia MLS. All rights reserved.
- 389 Young James Cir
- 453 Azalea Dr
- 418 Honeysuckle Ln
- 565 Patillo Rd
- 107 Woodridge Dr
- 562 Patillo Rd
- 342 Lakeshore Dr
- 491 Thurman Rd Unit TRACT C
- 108 Hilltop Cir
- 105 Bobolink Dr
- 0 Oakview Dr Unit 10472931
- 0 Oakview Dr Unit 7533331
- 106 Bob White Dr
- 230 Flintlock Trail
- 20 Carriage Trace
- 125 Bob White Dr
- 111 Audubon Pkwy
- 20 Lamp Post Ct
- 1080 Gardner Rd
- 0 E Atlanta Rd Unit @VALERIE CT 10464740
- 424 Azalea Dr
- 522 Knollwood Dr
- 309 Cedar Ln
- 30 Cotton Cir
- 314 Laurel Ln
- 211 Robin Ln
- 215 Belair Dr Unit B
- 546 Forest Hill Dr
- 208 Wildwood Dr
- 20 Freeman Dr
- 124 Ashland Dr
- 270 Carriage Cir
- 632 Cloudland Dr
- 431 Whitewater Trail
- 103 Springvalley Cir
- 158 Windsor Cir
- 125 Longview Rd
- 119 Longview Rd
- 115 Stratmore Place
- 112 Valerie Ct