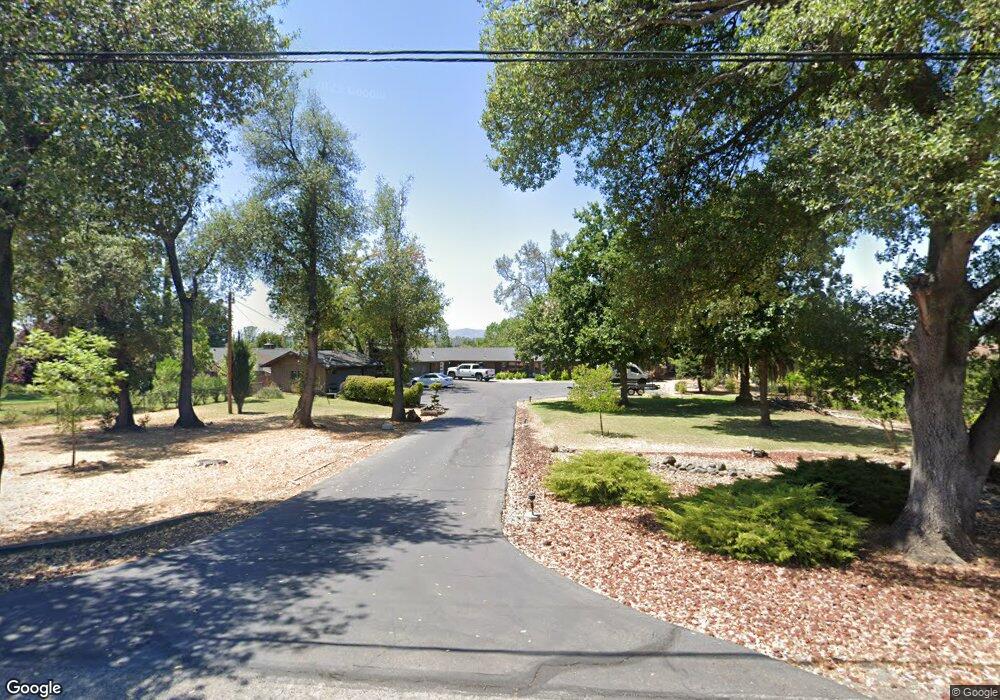
3930 Cheryl Dr Unit 1 Redding, CA 96002
South Bechelli NeighborhoodEstimated Value: $620,000 - $710,000
3
Beds
3
Baths
3,400
Sq Ft
$195/Sq Ft
Est. Value
About This Home
This home is located at 3930 Cheryl Dr Unit 1, Redding, CA 96002 and is currently estimated at $662,982, approximately $194 per square foot. 3930 Cheryl Dr Unit 1 is a home located in Shasta County with nearby schools including Lassen View Elementary School, Parsons Junior High School, and Enterprise High School.
Ownership History
Date
Name
Owned For
Owner Type
Purchase Details
Closed on
Apr 26, 2021
Sold by
Puckett Michael and Puckett Sherry
Bought by
Puckett Michael and Puckett Sherry
Current Estimated Value
Purchase Details
Closed on
Nov 7, 2018
Sold by
Herrick Michael G and Herrick Arlene J
Bought by
Puckett Michael and Puckett Sherry
Home Financials for this Owner
Home Financials are based on the most recent Mortgage that was taken out on this home.
Original Mortgage
$439,200
Outstanding Balance
$385,399
Interest Rate
4.7%
Mortgage Type
New Conventional
Estimated Equity
$277,583
Purchase Details
Closed on
May 9, 2000
Sold by
Coad William H and Coad Ardythe L
Bought by
Herrick Michael G and Herrick Arlene J
Home Financials for this Owner
Home Financials are based on the most recent Mortgage that was taken out on this home.
Original Mortgage
$75,000
Interest Rate
8.22%
Mortgage Type
Seller Take Back
Create a Home Valuation Report for This Property
The Home Valuation Report is an in-depth analysis detailing your home's value as well as a comparison with similar homes in the area
Home Values in the Area
Average Home Value in this Area
Purchase History
| Date | Buyer | Sale Price | Title Company |
|---|---|---|---|
| Puckett Michael | -- | None Available | |
| Puckett Michael | $549,000 | Fidelity Natl Title Co Of Ca | |
| Herrick Michael G | $350,000 | Fidelity National Title Co |
Source: Public Records
Mortgage History
| Date | Status | Borrower | Loan Amount |
|---|---|---|---|
| Open | Puckett Michael | $439,200 | |
| Previous Owner | Herrick Michael G | $75,000 |
Source: Public Records
Tax History
| Year | Tax Paid | Tax Assessment Tax Assessment Total Assessment is a certain percentage of the fair market value that is determined by local assessors to be the total taxable value of land and additions on the property. | Land | Improvement |
|---|---|---|---|---|
| 2025 | $6,533 | $612,415 | $117,127 | $495,288 |
| 2024 | $6,442 | $600,408 | $114,831 | $485,577 |
| 2023 | $6,442 | $588,636 | $112,580 | $476,056 |
| 2022 | $6,259 | $577,095 | $110,373 | $466,722 |
| 2021 | $6,045 | $565,780 | $108,209 | $457,571 |
| 2020 | $6,019 | $559,980 | $107,100 | $452,880 |
| 2019 | $5,969 | $549,000 | $105,000 | $444,000 |
| 2018 | $3,987 | $365,000 | $70,000 | $295,000 |
| 2017 | $4,139 | $365,000 | $70,000 | $295,000 |
| 2016 | $3,674 | $340,000 | $70,000 | $270,000 |
| 2015 | $3,644 | $335,000 | $60,000 | $275,000 |
| 2014 | $3,579 | $325,000 | $60,000 | $265,000 |
Source: Public Records
Map
Nearby Homes
- 3708 Traverse St
- 3650 Cheryl Dr
- 688 Julie Way
- 737 Estate St
- 607 Woodacre Dr
- 723 Woodacre Dr
- 751 Woodacre Dr
- 1115 2nd St
- 1209 C St
- 2940 Felstet Ln
- 5367 Rosswood Ln
- 3527 Adams Ln
- 1108 4th St
- 3428 Adams Ln
- 4323 Churn Crk Rd
- 3857 Eagle Pkwy
- 952 Camino Ct
- 0 Lot4 Unit 2 Ph 2 Stillwater Unit 25-4962
- 0 Lot3 Unit 2 Ph 2 Stillwater Unit 25-4961
- 0 Lot6 Unit 2 Ph 2 Stillwater Unit 25-4964
- 3930 Cheryl Dr
- 3900 Cheryl Dr
- 382 Loma Vista Dr
- 416 Loma Vista Dr
- 3708 Cheryl Dr
- 3886 Cheryl Dr
- 3931 Cheryl Dr
- 3903 Cheryl Dr
- 3965 Cheryl Dr
- 3897 Golf Dr Unit 3897 Golf Drive
- 3897 Golf Dr
- 3864 Cheryl Dr
- 4010 Cheryl Dr
- 3921 Golf Dr
- 3921 Golf Dr Unit 3921 Golf Drive
- 3932 Bechelli Ln
- 3873 Cheryl Dr Unit 1
- 3873 Cheryl Dr
- 387 Loma Vista Dr
- 3910 Bechelli Ln Unit 1
Your Personal Tour Guide
Ask me questions while you tour the home.