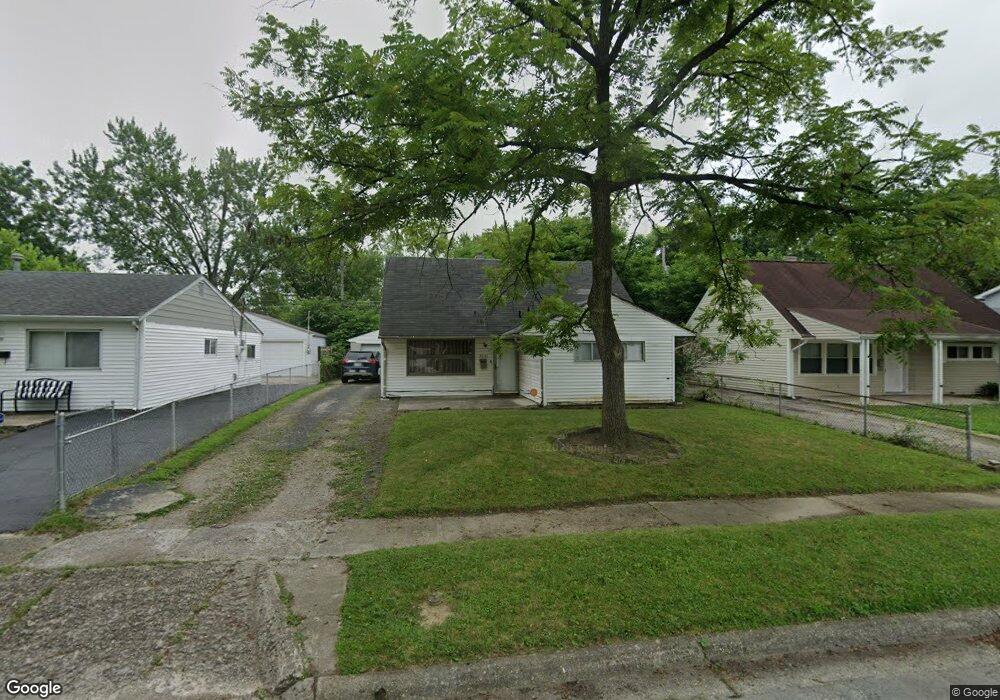
3931 Dillon Dr Columbus, OH 43227
Beechwood NeighborhoodEstimated Value: $175,000 - $234,000
5
Beds
1
Bath
1,375
Sq Ft
$148/Sq Ft
Est. Value
About This Home
This home is located at 3931 Dillon Dr, Columbus, OH 43227 and is currently estimated at $203,898, approximately $148 per square foot. 3931 Dillon Dr is a home located in Franklin County with nearby schools including Shady Lane Elementary School, Sherwood Middle School, and Walnut Ridge High School.
Ownership History
Date
Name
Owned For
Owner Type
Purchase Details
Closed on
Jul 10, 2018
Sold by
Bogin Igor
Bought by
Abi 3 Llc
Current Estimated Value
Purchase Details
Closed on
May 19, 2011
Sold by
Michael Aronov Yelena and Michael Arronov
Bought by
Bogin Igor
Purchase Details
Closed on
Mar 31, 2009
Sold by
Lasalle Bank National Association
Bought by
Aronov Yelena
Purchase Details
Closed on
Jan 12, 2009
Sold by
Kendig James L and Case #08Cve04 5908
Bought by
Lasalle Bank National Association
Purchase Details
Closed on
May 11, 1999
Sold by
Kendig Earl H and Kendig Frances P
Bought by
Kendig James L
Home Financials for this Owner
Home Financials are based on the most recent Mortgage that was taken out on this home.
Original Mortgage
$53,000
Interest Rate
8%
Purchase Details
Closed on
Dec 26, 1969
Bought by
Kendig Earl H
Create a Home Valuation Report for This Property
The Home Valuation Report is an in-depth analysis detailing your home's value as well as a comparison with similar homes in the area
Home Values in the Area
Average Home Value in this Area
Purchase History
| Date | Buyer | Sale Price | Title Company |
|---|---|---|---|
| Abi 3 Llc | -- | None Available | |
| Bogin Igor | $30,000 | Hummel | |
| Aronov Yelena | $32,000 | Nations Ti | |
| Lasalle Bank National Association | $50,250 | None Available | |
| Kendig James L | $66,500 | Amerititle Mill Run | |
| Kendig Earl H | -- | -- |
Source: Public Records
Mortgage History
| Date | Status | Borrower | Loan Amount |
|---|---|---|---|
| Previous Owner | Kendig James L | $53,000 |
Source: Public Records
Tax History Compared to Growth
Tax History
| Year | Tax Paid | Tax Assessment Tax Assessment Total Assessment is a certain percentage of the fair market value that is determined by local assessors to be the total taxable value of land and additions on the property. | Land | Improvement |
|---|---|---|---|---|
| 2024 | $2,470 | $53,900 | $14,000 | $39,900 |
| 2023 | $2,439 | $53,900 | $14,000 | $39,900 |
| 2022 | $1,527 | $28,740 | $4,900 | $23,840 |
| 2021 | $1,530 | $28,740 | $4,900 | $23,840 |
| 2020 | $1,532 | $28,740 | $4,900 | $23,840 |
| 2019 | $1,391 | $22,370 | $3,920 | $18,450 |
| 2018 | $722 | $22,370 | $3,920 | $18,450 |
| 2017 | $1,391 | $22,370 | $3,920 | $18,450 |
| 2016 | $832 | $12,250 | $3,850 | $8,400 |
| 2015 | $379 | $12,250 | $3,850 | $8,400 |
| 2014 | $988 | $12,250 | $3,850 | $8,400 |
| 2013 | $849 | $27,755 | $4,515 | $23,240 |
Source: Public Records
Map
Nearby Homes
- 3945 Dillon Dr
- 3955 E Fulton St
- 1220 Elderwood Ave
- 1294 Dellwood Ave
- 931 E Fulton St
- 4144 Mcallister Ave
- 4094 E Main St
- 963 Erickson Ave
- 1291 Westphal Ave
- 4181 Colby Ave
- 3598 Astor Ave
- 3563 Astor Ave
- 1490 Elaine Rd Unit 1462
- 4199 Wright Park
- 4363 E Mound St
- 3811 Brentwood Ct
- 798 S Yearling Rd
- 4295 Colby Ave
- 3566 Seabrook Ave
- 1640 Striebel Rd