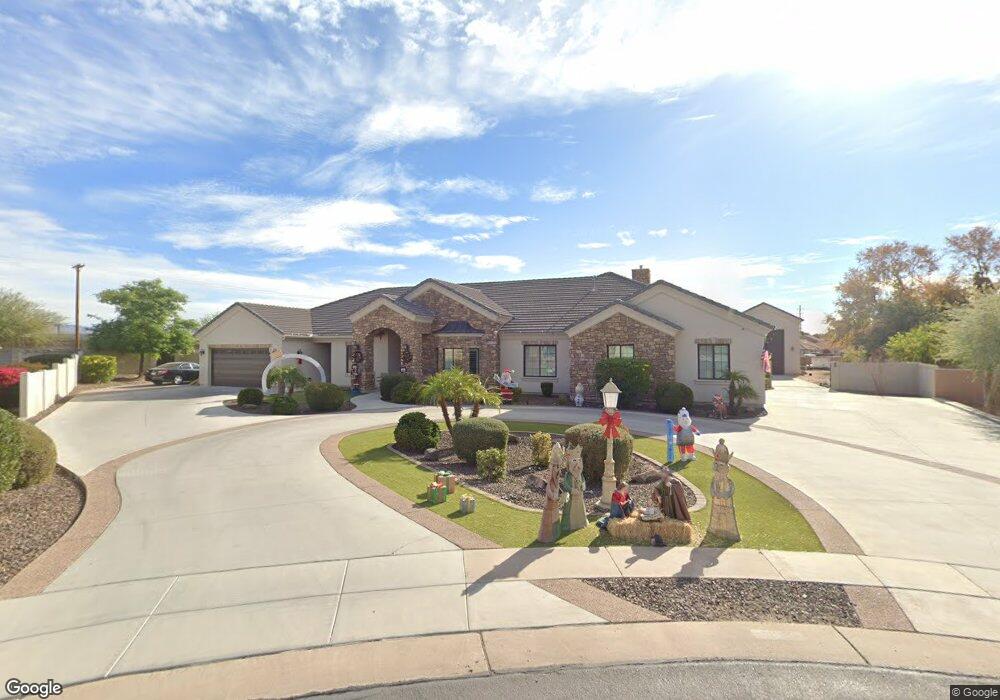
3931 E Oasis Cir Unit 31 Mesa, AZ 85215
Citrus NeighborhoodEstimated Value: $1,935,000 - $2,166,004
Studio
1
Bath
4,366
Sq Ft
$465/Sq Ft
Est. Value
About This Home
This home is located at 3931 E Oasis Cir Unit 31, Mesa, AZ 85215 and is currently estimated at $2,032,001, approximately $465 per square foot. 3931 E Oasis Cir Unit 31 is a home located in Maricopa County with nearby schools including Ishikawa Elementary School, Franklin at Brimhall Elementary School, and Franklin West Elementary School.
Ownership History
Date
Name
Owned For
Owner Type
Purchase Details
Closed on
Sep 6, 2018
Sold by
Hildebrandt Richard K and Hildebrandt Laurie A
Bought by
Hildebrandt Richard K and Hildebrandt Laurie A
Current Estimated Value
Purchase Details
Closed on
Dec 23, 2013
Sold by
Hogle John Wilson and Hogle Rhonda Elaine
Bought by
Hildebrandt Richard K and Hildebrandt Laurie
Purchase Details
Closed on
Nov 12, 2009
Sold by
Edwards Dennis Barry and Edwards Judy Ann
Bought by
Hogle John Wilson and Hogle Rhonda Elaine
Purchase Details
Closed on
Jul 28, 2009
Sold by
Edwards Dennis and Edwards Judy
Bought by
Edwards Family Revocable Living Trust
Purchase Details
Closed on
Mar 12, 2009
Sold by
M & I Marshall & Ilsley Bank
Bought by
Edwards Dennis and Edwards Judy
Purchase Details
Closed on
Dec 30, 2008
Sold by
Malais Michael Kevin and Malais Christine Cooley
Bought by
M & I Marshall & Ilsely Bank
Purchase Details
Closed on
Mar 29, 2007
Sold by
Peoria 145 Llc
Bought by
Malais Michael Kevin and Malais Christine Cooley
Purchase Details
Closed on
Jul 22, 2005
Sold by
Bagnod Evangelina
Bought by
Bagnod Hector D
Purchase Details
Closed on
Apr 21, 2003
Sold by
Phillips David and Phillips Jeanette
Bought by
Bowman Logan and Bowman Lori
Home Financials for this Owner
Home Financials are based on the most recent Mortgage that was taken out on this home.
Original Mortgage
$100,000
Interest Rate
5.84%
Mortgage Type
New Conventional
Purchase Details
Closed on
Jul 30, 1998
Sold by
Fam Developers Inc
Bought by
Phillips David and David Phillips C
Home Financials for this Owner
Home Financials are based on the most recent Mortgage that was taken out on this home.
Original Mortgage
$53,500
Interest Rate
6.88%
Mortgage Type
Seller Take Back
Purchase Details
Closed on
Jul 5, 1996
Sold by
Tramark Llc
Bought by
Fam Developers Inc
Create a Home Valuation Report for This Property
The Home Valuation Report is an in-depth analysis detailing your home's value as well as a comparison with similar homes in the area
Home Values in the Area
Average Home Value in this Area
Purchase History
| Date | Buyer | Sale Price | Title Company |
|---|---|---|---|
| Hildebrandt Richard K | -- | None Available | |
| Hildebrandt Richard K | $225,000 | Pioneer Title Agency Inc | |
| Hogle John Wilson | $310,000 | Magnus Title Agency | |
| Edwards Family Revocable Living Trust | -- | None Available | |
| Edwards Dennis | $225,000 | Fidelity National Title | |
| M & I Marshall & Ilsely Bank | $279,020 | Great American Title Agency | |
| Malais Michael Kevin | -- | Chicago Title Insurance Co | |
| Bagnod Hector D | -- | Chicago Title Insurance Co | |
| Bowman Logan | $170,000 | Fidelity National Title | |
| Phillips David | $98,500 | Transnation Title Insurance | |
| Fam Developers Inc | $82,500 | Transnation Title Ins Co |
Source: Public Records
Mortgage History
| Date | Status | Borrower | Loan Amount |
|---|---|---|---|
| Previous Owner | Bowman Logan | $100,000 | |
| Previous Owner | Phillips David | $53,500 |
Source: Public Records
Tax History
| Year | Tax Paid | Tax Assessment Tax Assessment Total Assessment is a certain percentage of the fair market value that is determined by local assessors to be the total taxable value of land and additions on the property. | Land | Improvement |
|---|---|---|---|---|
| 2025 | $9,868 | $104,201 | -- | -- |
| 2024 | $9,900 | $99,239 | -- | -- |
| 2023 | $9,900 | $126,320 | $25,260 | $101,060 |
| 2022 | $9,686 | $97,920 | $19,580 | $78,340 |
| 2021 | $9,779 | $92,710 | $18,540 | $74,170 |
| 2020 | $10,239 | $88,530 | $17,700 | $70,830 |
| 2019 | $9,577 | $90,000 | $18,000 | $72,000 |
| 2018 | $9,184 | $86,330 | $17,260 | $69,070 |
| 2017 | $8,914 | $82,670 | $16,530 | $66,140 |
| 2016 | $8,746 | $88,380 | $17,670 | $70,710 |
| 2015 | $1,979 | $41,152 | $41,152 | $0 |
Source: Public Records
Map
Nearby Homes
- 6462 E Oasis Cir
- 6454 E Oasis Cir
- 6446 E Omega Cir
- 6460 E Omega Cir
- 2812 N Norwalk Unit 106
- 2812 N Norwalk Unit 111
- 3765 E Palm St
- 3924 E Norcroft Cir
- 2440 N Maple
- 3531 E Norwood Cir
- 4041 E Hermosa Vista Dr
- 4010 E Leland St
- 3446 N Sunwood St
- 3450 N Sunwood St
- 3445 N Glenwood
- 3454 N Sunwood St
- 3449 N Glenwood
- 3453 N Glenwood
- 3618 E Roland St
- 3446 N Mayfair
- 3915 E Oasis Cir
- 3930 E Omega Cir
- 3918 E Oasis Cir
- 3914 E Omega Cir
- 3865 E Oasis Cir
- 3902 E Oasis Cir
- 3864 E Omega Cir
- 3849 E Oasis Cir
- 3852 E Oasis Cir
- 3848 E Omega Cir
- 3913 E Omega Cir
- 3929 E Omega Cir
- 3942 E Oasis Cir Unit 5
- 3865 E Palm Cir
- 3853 E Palm Cir
- 3863 E Omega Cir
- 3836 E Oasis Cir
- 3948 E Oasis Cir Unit 6
- 3829 E Oasis Cir
- 3940 E Palm St Unit 2
Your Personal Tour Guide
Ask me questions while you tour the home.