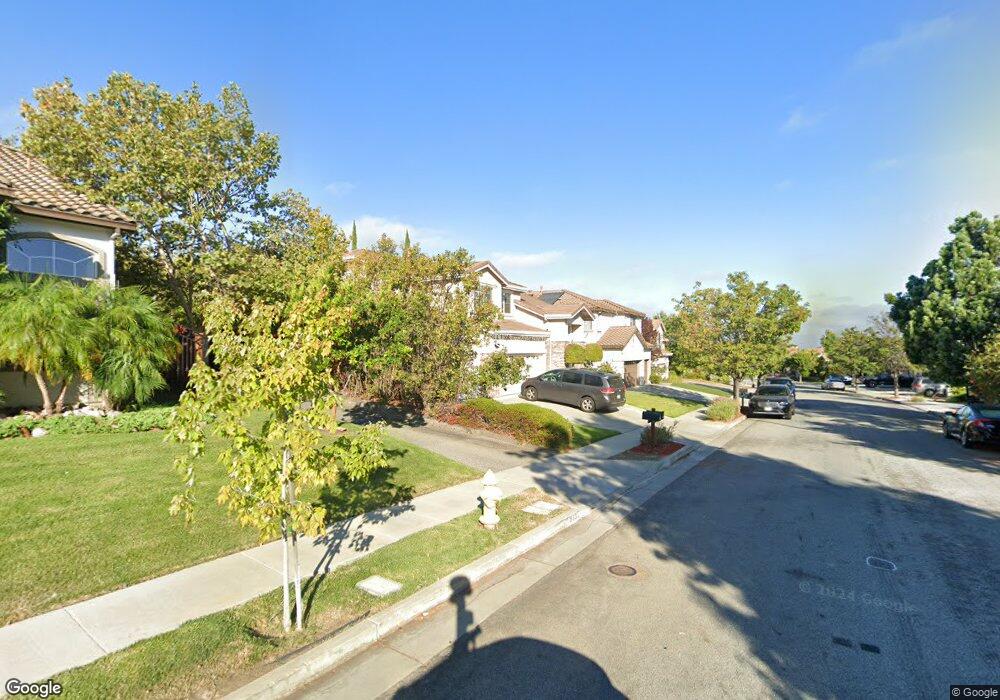
3932 Mars Ct San Jose, CA 95121
Silver Creek NeighborhoodEstimated Value: $2,326,041 - $2,590,000
4
Beds
3
Baths
2,558
Sq Ft
$972/Sq Ft
Est. Value
About This Home
This home is located at 3932 Mars Ct, San Jose, CA 95121 and is currently estimated at $2,486,010, approximately $971 per square foot. 3932 Mars Ct is a home located in Santa Clara County with nearby schools including James Franklin Smith Elementary School, Chaboya Middle School, and Silver Creek High School.
Ownership History
Date
Name
Owned For
Owner Type
Purchase Details
Closed on
Aug 13, 2025
Sold by
Katta Laxma Reddy and Katta Shobha R
Bought by
Katta Family Revocable Trust and Katta
Current Estimated Value
Purchase Details
Closed on
Sep 3, 1999
Sold by
Braddock & Logan Group Lp
Bought by
Katta Laxma R and Katta Shobha R
Home Financials for this Owner
Home Financials are based on the most recent Mortgage that was taken out on this home.
Original Mortgage
$462,400
Interest Rate
7.12%
Create a Home Valuation Report for This Property
The Home Valuation Report is an in-depth analysis detailing your home's value as well as a comparison with similar homes in the area
Home Values in the Area
Average Home Value in this Area
Purchase History
| Date | Buyer | Sale Price | Title Company |
|---|---|---|---|
| Katta Family Revocable Trust | -- | None Listed On Document | |
| Katta Laxma R | $578,500 | First American Title Guarant |
Source: Public Records
Mortgage History
| Date | Status | Borrower | Loan Amount |
|---|---|---|---|
| Previous Owner | Katta Laxma R | $462,400 |
Source: Public Records
Tax History
| Year | Tax Paid | Tax Assessment Tax Assessment Total Assessment is a certain percentage of the fair market value that is determined by local assessors to be the total taxable value of land and additions on the property. | Land | Improvement |
|---|---|---|---|---|
| 2025 | $13,526 | $888,738 | $345,809 | $542,929 |
| 2024 | $13,526 | $871,313 | $339,029 | $532,284 |
| 2023 | $13,245 | $854,230 | $332,382 | $521,848 |
| 2022 | $13,103 | $837,481 | $325,865 | $511,616 |
| 2021 | $12,857 | $821,061 | $319,476 | $501,585 |
| 2020 | $12,300 | $812,643 | $316,201 | $496,442 |
| 2019 | $11,957 | $796,709 | $310,001 | $486,708 |
| 2018 | $11,828 | $781,088 | $303,923 | $477,165 |
| 2017 | $11,627 | $765,773 | $297,964 | $467,809 |
| 2016 | $11,089 | $750,759 | $292,122 | $458,637 |
| 2015 | $10,956 | $739,483 | $287,735 | $451,748 |
| 2014 | $10,169 | $724,998 | $282,099 | $442,899 |
Source: Public Records
Map
Nearby Homes
- 3543 Kettmann Rd
- 2652 Orinda Dr
- 3474 Woodside Ln
- 3874 Forester Ct
- 2114 Bennighof Ct
- 3630 San Felipe Rd
- 2166 Shadow Ridge Way
- 2561 Yerba Bank Ct
- 2732 Buena View Ct
- 2831 Riedel Rd
- 3854 Deans Place Way
- 1659 Cedarcreek Ct
- 2925 Wycliffe Ct
- 3024 Oliver Dr
- 3211 Pentland Ct
- 2855 Weyers Ct
- 3341 Placer Creek Ct
- 1520 E Capitol Expy Unit 54
- 3121 Malton Ct
- 3032 Oakbridge Dr Unit 3032
Your Personal Tour Guide
Ask me questions while you tour the home.