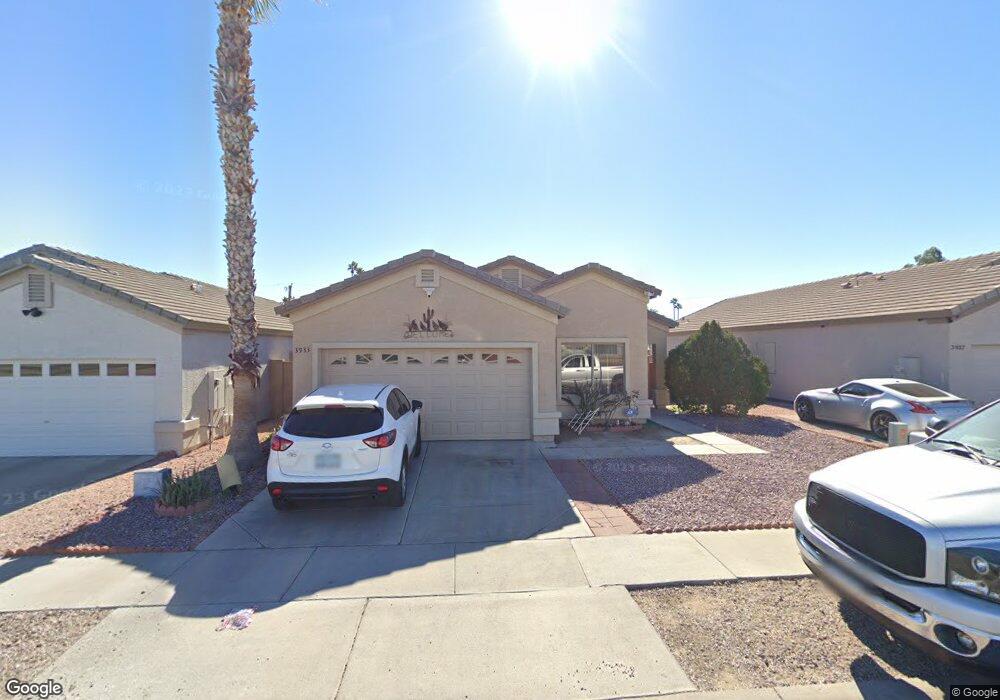
3933 W Oregon Ave Phoenix, AZ 85019
Alhambra NeighborhoodEstimated Value: $297,619 - $358,000
--
Bed
2
Baths
1,319
Sq Ft
$257/Sq Ft
Est. Value
About This Home
This home is located at 3933 W Oregon Ave, Phoenix, AZ 85019 and is currently estimated at $338,655, approximately $256 per square foot. 3933 W Oregon Ave is a home located in Maricopa County with nearby schools including Sevilla Elementary School East, Sevilla Elementary School West, and Alhambra High School.
Ownership History
Date
Name
Owned For
Owner Type
Purchase Details
Closed on
Nov 19, 2003
Sold by
Ruiz Victor
Bought by
Ruiz Victor and Ruiz Elda
Current Estimated Value
Purchase Details
Closed on
May 15, 2003
Sold by
Ruiz Elda
Bought by
Ruiz Victor
Home Financials for this Owner
Home Financials are based on the most recent Mortgage that was taken out on this home.
Original Mortgage
$110,925
Outstanding Balance
$48,070
Interest Rate
5.75%
Mortgage Type
Purchase Money Mortgage
Estimated Equity
$290,585
Purchase Details
Closed on
Feb 21, 2002
Sold by
Kirwin Thomas H
Bought by
Tiger Properties Llc
Purchase Details
Closed on
Mar 13, 2001
Sold by
Mandalay Properties Llc
Bought by
Kirwin Thomas H
Home Financials for this Owner
Home Financials are based on the most recent Mortgage that was taken out on this home.
Original Mortgage
$93,600
Interest Rate
7.11%
Mortgage Type
New Conventional
Create a Home Valuation Report for This Property
The Home Valuation Report is an in-depth analysis detailing your home's value as well as a comparison with similar homes in the area
Home Values in the Area
Average Home Value in this Area
Purchase History
| Date | Buyer | Sale Price | Title Company |
|---|---|---|---|
| Ruiz Victor | -- | Century Title Agency Inc | |
| Ruiz Victor | -- | Century Title Agency Inc | |
| Ruiz Victor | $123,250 | Century Title Agency Inc | |
| Arries Kimberly K | $123,250 | Century Title Agency Inc | |
| Tiger Properties Llc | $104,000 | -- | |
| Kirwin Thomas H | $104,000 | Fidelity National Title |
Source: Public Records
Mortgage History
| Date | Status | Borrower | Loan Amount |
|---|---|---|---|
| Open | Arries Kimberly K | $110,925 | |
| Closed | Ruiz Victor | $110,925 | |
| Previous Owner | Kirwin Thomas H | $93,600 |
Source: Public Records
Tax History Compared to Growth
Tax History
| Year | Tax Paid | Tax Assessment Tax Assessment Total Assessment is a certain percentage of the fair market value that is determined by local assessors to be the total taxable value of land and additions on the property. | Land | Improvement |
|---|---|---|---|---|
| 2025 | $1,148 | $8,937 | -- | -- |
| 2024 | $1,156 | $8,511 | -- | -- |
| 2023 | $1,156 | $24,500 | $4,900 | $19,600 |
| 2022 | $1,138 | $18,880 | $3,770 | $15,110 |
| 2021 | $1,159 | $17,150 | $3,430 | $13,720 |
| 2020 | $1,111 | $15,520 | $3,100 | $12,420 |
| 2019 | $1,098 | $13,260 | $2,650 | $10,610 |
| 2018 | $1,006 | $12,920 | $2,580 | $10,340 |
| 2017 | $994 | $11,020 | $2,200 | $8,820 |
| 2016 | $950 | $9,880 | $1,970 | $7,910 |
| 2015 | $902 | $8,060 | $1,610 | $6,450 |
Source: Public Records
Map
Nearby Homes
- 5222 N 41st Ave
- 5039 N 40th Ave
- 3746 W Vermont Ave
- 5524 N 39th Ave
- 5251 N 42nd Ln Unit 563
- 3928 W Camelback Rd
- 5212 N 42nd Ln Unit 592
- 5203 N 42nd Dr Unit 604
- 5610 N 38th Dr Unit 3
- 5002 N 41st Ave
- 5602 N 41st Ave
- 4019 W San Miguel Ave
- 5632 N 38th Dr
- 5634 N 39th Ave
- 3746 W Luke Ave
- 3705 W Luke Ave
- 4750 N 39th Dr
- 5654 N 39th Ave
- 5657 N 39th Ave
- 3803 W San Miguel Ave
- 3929 W Oregon Ave
- 3937 W Oregon Ave
- 3925 W Oregon Ave
- 3941 W Oregon Ave
- 3936 W Colter St
- 3921 W Oregon Ave
- 3928 W Colter St
- 3945 W Oregon Ave
- 3944 W Colter St
- 3917 W Oregon Ave
- 3922 W Colter St
- 4003 W Oregon Ave
- 4002 W Colter St
- 3913 W Oregon Ave
- 4007 W Oregon Ave
- 3916 W Colter St
- 5215 N 40th Ave
- 4010 W Colter St
- 4011 W Oregon Ave
- 5214 N 39th Dr