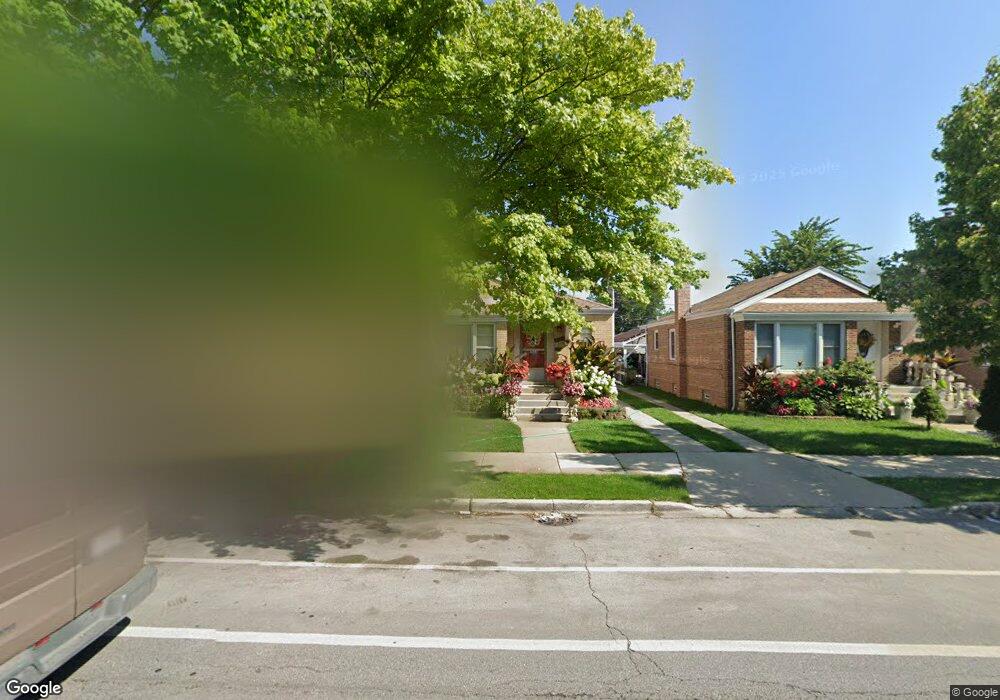
3934 W 83rd St Chicago, IL 60652
Ashburn NeighborhoodEstimated Value: $231,000 - $297,000
2
Beds
1
Bath
940
Sq Ft
$289/Sq Ft
Est. Value
About This Home
This home is located at 3934 W 83rd St, Chicago, IL 60652 and is currently estimated at $271,297, approximately $288 per square foot. 3934 W 83rd St is a home located in Cook County with nearby schools including Dawes Elementary School, Bogan Computer Technical High School, and St Bede-Venerable School.
Ownership History
Date
Name
Owned For
Owner Type
Purchase Details
Closed on
Feb 2, 2007
Sold by
Dela Torre Javier and De La Torre Adela
Bought by
Vazquez Hector and Vazquez Rosalba
Current Estimated Value
Home Financials for this Owner
Home Financials are based on the most recent Mortgage that was taken out on this home.
Original Mortgage
$140,000
Outstanding Balance
$84,366
Interest Rate
6.27%
Mortgage Type
Purchase Money Mortgage
Estimated Equity
$186,931
Purchase Details
Closed on
May 26, 2004
Sold by
Dluhy Emily M
Bought by
Delatorre Javier
Home Financials for this Owner
Home Financials are based on the most recent Mortgage that was taken out on this home.
Original Mortgage
$147,155
Interest Rate
6.35%
Mortgage Type
Unknown
Purchase Details
Closed on
Nov 11, 1997
Sold by
Dluhy George M
Bought by
Dluhy Emily M and Emily M Dluhy Trust
Create a Home Valuation Report for This Property
The Home Valuation Report is an in-depth analysis detailing your home's value as well as a comparison with similar homes in the area
Home Values in the Area
Average Home Value in this Area
Purchase History
| Date | Buyer | Sale Price | Title Company |
|---|---|---|---|
| Vazquez Hector | $175,000 | Multiple | |
| Delatorre Javier | $155,000 | First American Title | |
| Dluhy Emily M | -- | -- |
Source: Public Records
Mortgage History
| Date | Status | Borrower | Loan Amount |
|---|---|---|---|
| Open | Vazquez Hector | $140,000 | |
| Previous Owner | Delatorre Javier | $147,155 |
Source: Public Records
Tax History Compared to Growth
Tax History
| Year | Tax Paid | Tax Assessment Tax Assessment Total Assessment is a certain percentage of the fair market value that is determined by local assessors to be the total taxable value of land and additions on the property. | Land | Improvement |
|---|---|---|---|---|
| 2024 | $3,121 | $18,000 | $2,835 | $15,165 |
| 2023 | $3,022 | $18,000 | $3,780 | $14,220 |
| 2022 | $3,022 | $18,000 | $3,780 | $14,220 |
| 2021 | $2,973 | $18,000 | $3,780 | $14,220 |
| 2020 | $2,445 | $13,982 | $3,780 | $10,202 |
| 2019 | $2,453 | $15,536 | $3,780 | $11,756 |
| 2018 | $2,411 | $15,536 | $3,780 | $11,756 |
| 2017 | $2,095 | $13,020 | $3,307 | $9,713 |
| 2016 | $2,127 | $13,020 | $3,307 | $9,713 |
| 2015 | $1,923 | $13,020 | $3,307 | $9,713 |
| 2014 | $1,864 | $12,513 | $3,071 | $9,442 |
| 2013 | $1,816 | $12,513 | $3,071 | $9,442 |
Source: Public Records
Map
Nearby Homes
- 3928 W 82nd Place
- 3853 W 83rd Place
- 3826 W 83rd St
- 8154 S Karlov Ave
- 3849 W 84th St
- 3935 W 84th Place
- 8510 S Komensky Ave
- 3720 W 82nd St
- 3785 W Columbus Ave Unit 4
- 8515 S Kedvale Ave
- 3756 W 85th Place
- 3644 W 82nd St
- 8100 S Kildare Ave
- 7932 S Pulaski Rd Unit 301
- 4263 W 81st St
- 4327 W 81st St
- 3631 W 80th Place
- 3853 W 86th Place
- 7964 S Tripp Ave
- 3617 W 80th Place
- 3940 W 83rd St
- 3940 W 83rd St
- 3926 W 83rd St
- 3942 W 83rd St
- 3924 W 83rd St
- 3937 W 82nd Place
- 3933 W 82nd Place
- 3920 W 83rd St
- 3941 W 82nd Place
- 3929 W 82nd Place
- 3945 W 82nd Place
- 3927 W 82nd Place
- 3916 W 83rd St
- 3923 W 82nd Place
- 3937 W 83rd St
- 3933 W 83rd St
- 3941 W 83rd St
- 3929 W 83rd St
- 3943 W 83rd St
- 3927 W 83rd St