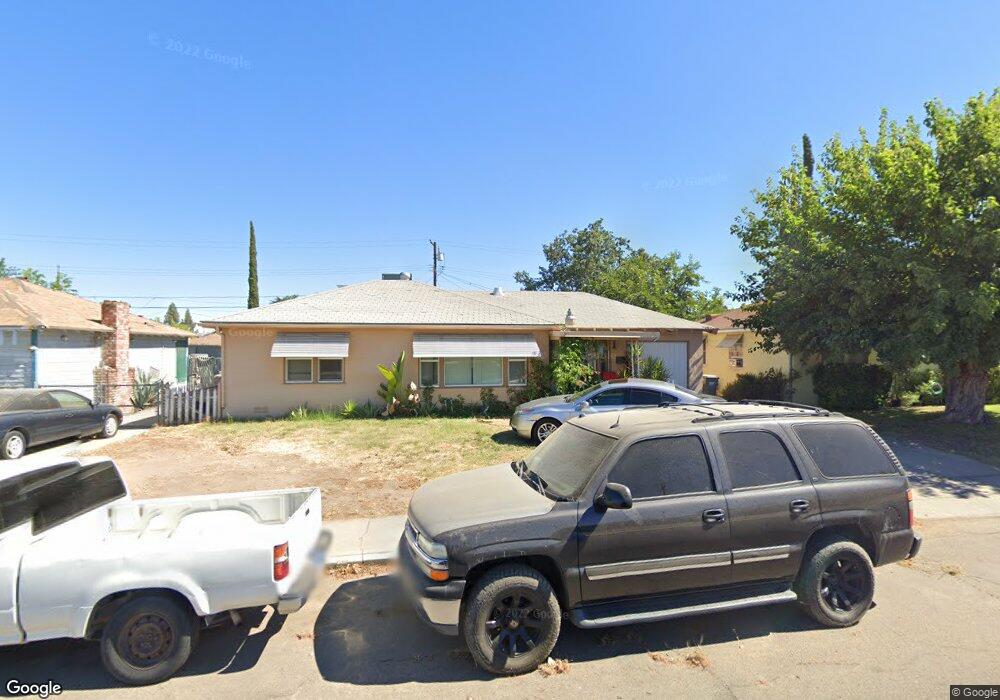
3935 Kenmore Dr N Fresno, CA 93703
McLane NeighborhoodEstimated Value: $244,000 - $285,000
2
Beds
1
Bath
950
Sq Ft
$279/Sq Ft
Est. Value
About This Home
This home is located at 3935 Kenmore Dr N, Fresno, CA 93703 and is currently estimated at $265,066, approximately $279 per square foot. 3935 Kenmore Dr N is a home located in Fresno County with nearby schools including Wishon Elementary School, Scandinavian Middle School, and Mclane High School.
Ownership History
Date
Name
Owned For
Owner Type
Purchase Details
Closed on
Jan 3, 2022
Sold by
Samurai Real Estate Inc
Bought by
Samurai Properties Inc
Current Estimated Value
Purchase Details
Closed on
Aug 28, 2014
Sold by
Niko Homes Inc
Bought by
Samurai Real Estate Inc
Purchase Details
Closed on
Mar 4, 2010
Sold by
Dickinson Ardyce A
Bought by
Niko Real Estate Fund Llc
Purchase Details
Closed on
Aug 24, 2006
Sold by
Day Marion F
Bought by
Day Marion F and Marion F Day Family Trust
Purchase Details
Closed on
Jul 14, 2005
Sold by
Day Marion F
Bought by
Day Marion F
Home Financials for this Owner
Home Financials are based on the most recent Mortgage that was taken out on this home.
Original Mortgage
$285,000
Interest Rate
5.09%
Mortgage Type
Reverse Mortgage Home Equity Conversion Mortgage
Purchase Details
Closed on
Feb 27, 1995
Sold by
Day Marion F and Day Doris J
Bought by
Day Marion F and Day Doris J
Create a Home Valuation Report for This Property
The Home Valuation Report is an in-depth analysis detailing your home's value as well as a comparison with similar homes in the area
Home Values in the Area
Average Home Value in this Area
Purchase History
| Date | Buyer | Sale Price | Title Company |
|---|---|---|---|
| Samurai Properties Inc | -- | None Available | |
| Samurai Real Estate Inc | -- | None Available | |
| Niko Real Estate Fund Llc | $63,000 | Fidelity National Title Co | |
| Day Marion F | -- | None Available | |
| Day Marion F | -- | Alliance Title Company | |
| Day Marion F | -- | -- |
Source: Public Records
Mortgage History
| Date | Status | Borrower | Loan Amount |
|---|---|---|---|
| Previous Owner | Day Marion F | $285,000 |
Source: Public Records
Tax History Compared to Growth
Tax History
| Year | Tax Paid | Tax Assessment Tax Assessment Total Assessment is a certain percentage of the fair market value that is determined by local assessors to be the total taxable value of land and additions on the property. | Land | Improvement |
|---|---|---|---|---|
| 2025 | $1,004 | $81,307 | $20,646 | $60,661 |
| 2023 | $985 | $78,152 | $19,846 | $58,306 |
| 2022 | $972 | $76,620 | $19,457 | $57,163 |
| 2021 | $946 | $75,119 | $19,076 | $56,043 |
| 2020 | $942 | $74,350 | $18,881 | $55,469 |
| 2019 | $906 | $72,893 | $18,511 | $54,382 |
| 2018 | $887 | $71,465 | $18,149 | $53,316 |
| 2017 | $872 | $70,065 | $17,794 | $52,271 |
| 2016 | $843 | $68,693 | $17,446 | $51,247 |
| 2015 | $830 | $67,662 | $17,184 | $50,478 |
| 2014 | $815 | $66,338 | $16,848 | $49,490 |
Source: Public Records
Map
Nearby Homes
- 3803 E Clinton Ave
- 4054 Arden Dr S
- 2042 Mayfair Dr E
- 3514 Mayfair Dr N
- 2154 Norris Dr E
- 3415 E Terrace Ave
- 4318 E Fairfax Ave
- 3803 E Shields Ave
- 3250 E Clinton Ave
- 2240
- 0 Tba Unit 634245
- 4454 E Simpson Ave
- 3926 E Fountain Way
- 2044 Mayfair Dr W
- 2513 N 2nd St
- 3445 N 9th St
- 3256 Mayfair Blvd
- 2414 N 1st St
- 2136 N First St
- 3140 E Weldon Ave
- 3945 Kenmore Dr N
- 3925 Kenmore Dr N
- 3955 Kenmore Dr N
- 3915 Kenmore Dr N
- 3922 E Clinton Ave
- 3942 E Clinton Ave
- 3912 E Clinton Ave
- 3952 E Clinton Ave
- 3942 Kenmore Dr N
- 3932 Kenmore Dr N
- 3965 Kenmore Dr N
- 3905 Kenmore Dr N
- 3952 Kenmore Dr N
- 3922 Kenmore Dr N
- 3962 E Clinton Ave
- 3902 E Clinton Ave
- 3962 Kenmore Dr N
- 3912 Kenmore Dr N
- 3975 Kenmore Dr N
- 3972 Kenmore Dr N