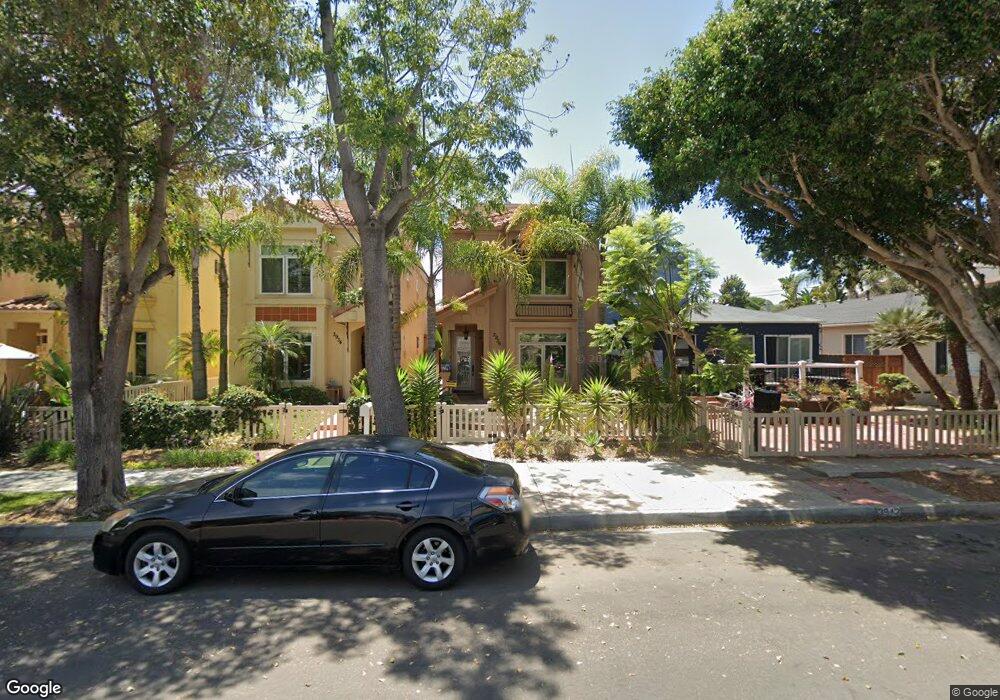
3936 Sequoia St San Diego, CA 92109
Pacific Beach NeighborhoodEstimated Value: $1,767,000 - $2,344,000
3
Beds
3
Baths
1,792
Sq Ft
$1,098/Sq Ft
Est. Value
About This Home
This home is located at 3936 Sequoia St, San Diego, CA 92109 and is currently estimated at $1,967,157, approximately $1,097 per square foot. 3936 Sequoia St is a home located in San Diego County with nearby schools including Crown Point Junior Music Academy, Pacific Beach Middle, and Mission Bay High School.
Ownership History
Date
Name
Owned For
Owner Type
Purchase Details
Closed on
Dec 17, 2012
Sold by
Chrapowicki Stanley E and Chrapowicki Stanley F
Bought by
Chrapowicki Stanley E and Chrapowicki Teresa
Current Estimated Value
Purchase Details
Closed on
Dec 4, 2012
Sold by
Williams Diane Lorraine
Bought by
Chrapowicki Stanley F and Chrapowicki Teresa Z
Purchase Details
Closed on
Jun 28, 2011
Sold by
Williams Diane Lorraine
Bought by
Williams Diane Lorraine
Purchase Details
Closed on
Jan 19, 2009
Sold by
Williams Oren Clay and Williams Diane Lorraine
Bought by
Williams Oren Clay and Williams Diane Lorraine
Purchase Details
Closed on
Jul 27, 2007
Sold by
2004 Sequoia Estates Ltd
Bought by
Williams Oren Clay and Williams Diane Lorraine
Home Financials for this Owner
Home Financials are based on the most recent Mortgage that was taken out on this home.
Original Mortgage
$671,250
Interest Rate
7%
Mortgage Type
VA
Purchase Details
Closed on
Dec 8, 1999
Sold by
Johnson John C & Joyce M Family Trust
Bought by
Johnson Joyce M
Purchase Details
Closed on
Sep 24, 1993
Sold by
Johnson John Carl and Johnson Joyce Marie
Bought by
Johnson John C and Johnson Joyce M
Create a Home Valuation Report for This Property
The Home Valuation Report is an in-depth analysis detailing your home's value as well as a comparison with similar homes in the area
Home Values in the Area
Average Home Value in this Area
Purchase History
| Date | Buyer | Sale Price | Title Company |
|---|---|---|---|
| Chrapowicki Stanley E | -- | Accommodation | |
| Chrapowicki Stanley F | $765,000 | Fidelity National Title Comp | |
| Williams Diane Lorraine | -- | None Available | |
| Williams Oren Clay | -- | None Available | |
| Williams Oren Clay | -- | None Available | |
| Williams Oren Clay | $895,000 | First American Title | |
| Johnson Joyce M | -- | -- | |
| Johnson John C | -- | -- |
Source: Public Records
Mortgage History
| Date | Status | Borrower | Loan Amount |
|---|---|---|---|
| Previous Owner | Williams Oren Clay | $671,250 |
Source: Public Records
Tax History Compared to Growth
Tax History
| Year | Tax Paid | Tax Assessment Tax Assessment Total Assessment is a certain percentage of the fair market value that is determined by local assessors to be the total taxable value of land and additions on the property. | Land | Improvement |
|---|---|---|---|---|
| 2025 | $11,291 | $942,029 | $568,164 | $373,865 |
| 2024 | $11,291 | $923,559 | $557,024 | $366,535 |
| 2023 | $11,040 | $905,451 | $546,102 | $359,349 |
| 2022 | $10,745 | $887,698 | $535,395 | $352,303 |
| 2021 | $10,670 | $870,294 | $524,898 | $345,396 |
| 2020 | $10,540 | $861,371 | $519,516 | $341,855 |
| 2019 | $10,351 | $844,482 | $509,330 | $335,152 |
| 2018 | $9,675 | $827,925 | $499,344 | $328,581 |
| 2017 | $80 | $811,692 | $489,553 | $322,139 |
| 2016 | $9,292 | $795,777 | $479,954 | $315,823 |
| 2015 | $9,154 | $783,825 | $472,745 | $311,080 |
| 2014 | $9,008 | $768,472 | $463,485 | $304,987 |
Source: Public Records
Map
Nearby Homes
- 3968 Sequoia St
- 3955 Shasta St
- 3955 Honeycutt St Unit 201
- 1703 La Playa Ave Unit B
- 4036 Shasta St Unit 14
- 4073 Kendall St Unit 2
- 4053-55 Jewell St
- 4064 Honeycutt St
- 3943 Ingraham St
- 4015 Crown Point Dr Unit 308
- 1654 Oliver Ave Unit 6
- 4037 Haines St
- 3736 Promontory St
- 3712 Promontory St
- 3843 Riviera Dr Unit 1
- 2023 Reed Ave Unit 1A
- 3705 Haines St
- 3850 Riviera Dr Unit 3B
- 3986 Riviera Dr
- 3828 Riviera Dr Unit 2B
- 3934 Sequoia St
- 3942 Sequoia St
- 3930 Sequoia St
- 3950 Sequoia St
- 3928 Sequoia St
- 3918 Sequoia St Unit 22
- 3956 Sequoia St
- 3935 Kendall St
- 3927 Kendall St
- 0 N of Garnet W of Cass Unit 150001861
- 3951 Kendall St
- 3962 Sequoia St
- 3921 Kendall St
- 3943 Kendall St Unit 45
- 3912 Sequoia St
- 3957 Sequoia St
- 3917 Kendall St
- 3933 Sequoia St Unit 35
- 3943 Sequoia St
- 3947 Sequoia St