W
Seller's Agent in 2026
Warren Fortier
Real Broker
1 in this area
177 Total Sales

Estimated Value: $126,000 - $170,990
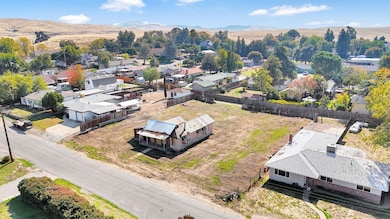
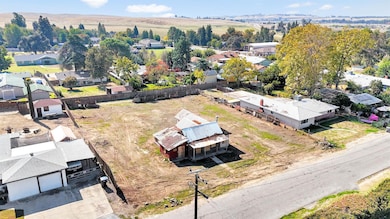
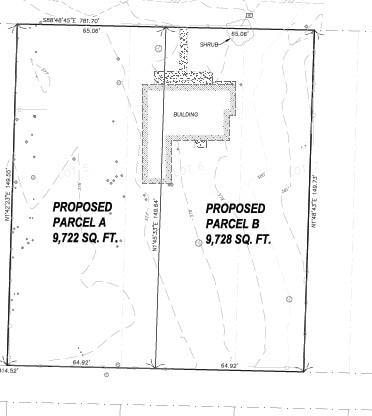
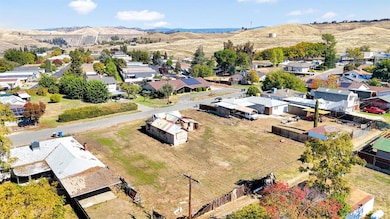
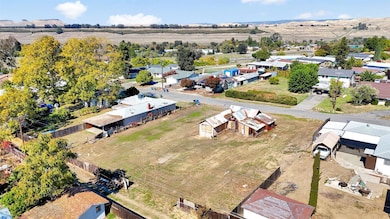
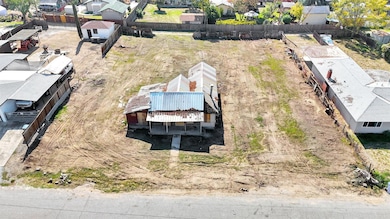
Calling all builders and investors this is an incredible opportunity in the heart of Friant! This property offers an approved tentative map to split the lot into two parcels, creating endless potential for development, resale, or custom home builds. The true value lies in the land and its prime location just moments from Brighton Crest, Table Mountain, and Millerton Lake, where scenic views, rolling hills, and nearby trails make this area a sought-after destination for those who love nature and tranquility. Convenient access to Highway 41, providing an easy commute to Fresno and Clovis while maintaining the serenity of country living. Whether you're looking to build, invest, or hold for future growth, this property delivers exceptional potential in one of Friant's most scenic and fast-growing areas.
We collect this data history from publicly available records. To have your information removed, we recommend requesting removal directly through your county’s website.
We collect this data history from publicly available records. To have your information removed, we recommend requesting removal directly through your county’s website.
| Date | Buyer | Sale Price | Title Company |
|---|---|---|---|
| $130,000 | Fidelity National Title Compan | ||
| -- | Fidelity National Title Compan | ||
| $22,000 | Placer Title Company | ||
| -- | -- |
We collect this data history from publicly available records. To have your information removed, we recommend requesting removal directly through your county’s website.
| Date | Event | Price | List to Sale | Price per Sq Ft |
|---|---|---|---|---|
| 03/02/2026 03/02/26 | Sold | $130,000 | 0.0% | $133 / Sq Ft |
| 02/12/2026 02/12/26 | Pending | -- | -- | -- |
| 10/22/2025 10/22/25 | For Sale | $130,000 | -- | $133 / Sq Ft |
We collect this data history from publicly available records. To have your information removed, we recommend requesting removal directly through your county’s website.
| Year | Tax Paid | Tax Assessment Tax Assessment Total Assessment is a certain percentage of the fair market value that is determined by local assessors to be the total taxable value of land and additions on the property. | Land | Improvement |
|---|---|---|---|---|
| 2025 | $1,125 | $75,000 | $75,000 | -- |
| 2023 | $1,528 | $74,637 | $26,644 | $47,993 |
| 2022 | $869 | $73,174 | $26,122 | $47,052 |
| 2021 | $844 | $71,740 | $25,610 | $46,130 |
| 2020 | $886 | $71,005 | $25,348 | $45,657 |
| 2019 | $870 | $69,613 | $24,851 | $44,762 |
| 2018 | $852 | $68,249 | $24,364 | $43,885 |
| 2017 | $838 | $66,912 | $23,887 | $43,025 |
| 2016 | $811 | $65,601 | $23,419 | $42,182 |
| 2015 | $799 | $64,617 | $23,068 | $41,549 |
| 2014 | $785 | $63,353 | $22,617 | $40,736 |
W
Seller's Agent in 2026
Warren Fortier
Real Broker
1 in this area
177 Total Sales

Seller Co-Listing Agent in 2026
Deborah Bento
Real Brokerage Technologies
(559) 231-6409
1 in this area
55 Total Sales
Buyer's Agent in 2026
Lucy Salazar
RE/MAX
2 in this area
61 Total Sales
Source: Fresno MLS
MLS Number: 638870
APN: 300-150-44
Disclaimer: Certain information contained herein is derived from information provided by parties other than Homes.com. All information provided is deemed reliable, but is not guaranteed to be accurate and should be independently verified.
![]() IDX information is provided exclusively for personal, non-commercial use, and may not be used for any purpose other than to identify prospective properties consumers may be interested in purchasing. Information is deemed reliable but not guaranteed.
IDX information is provided exclusively for personal, non-commercial use, and may not be used for any purpose other than to identify prospective properties consumers may be interested in purchasing. Information is deemed reliable but not guaranteed.
Ask me questions while you tour the home.