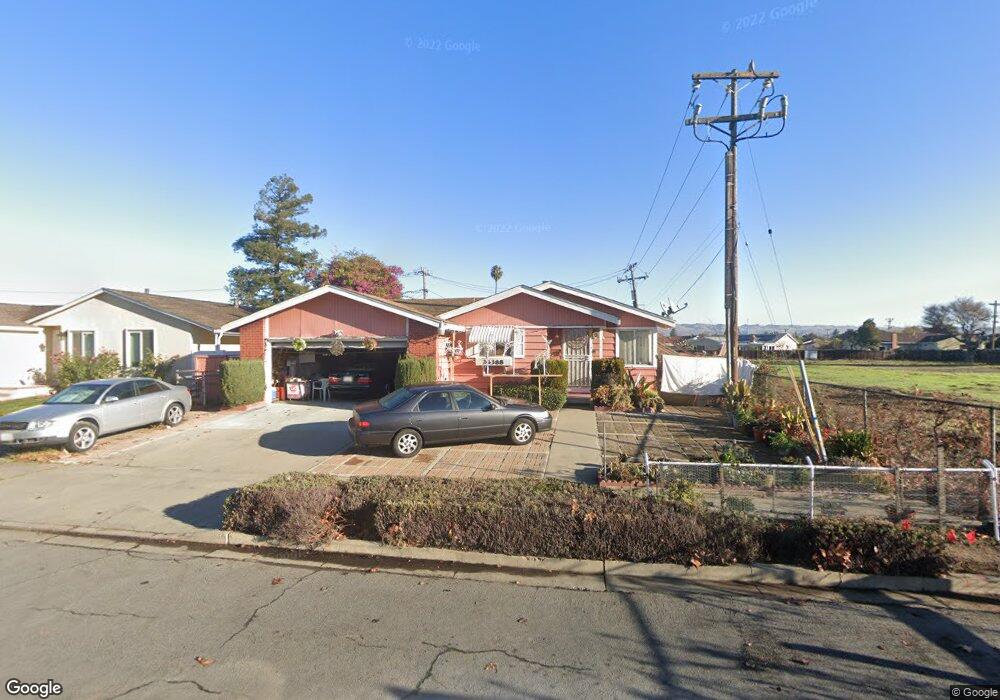
39388 Blacow Rd Fremont, CA 94538
Sundale NeighborhoodEstimated Value: $1,139,000 - $1,376,000
3
Beds
2
Baths
1,308
Sq Ft
$979/Sq Ft
Est. Value
About This Home
This home is located at 39388 Blacow Rd, Fremont, CA 94538 and is currently estimated at $1,280,960, approximately $979 per square foot. 39388 Blacow Rd is a home located in Alameda County with nearby schools including Joseph Azevada Elementary School, G.M. Walters Middle School, and John F. Kennedy High School.
Ownership History
Date
Name
Owned For
Owner Type
Purchase Details
Closed on
Mar 29, 2002
Sold by
Venzon London P
Bought by
Venzon Menardo T and Venzon Carmen P
Current Estimated Value
Home Financials for this Owner
Home Financials are based on the most recent Mortgage that was taken out on this home.
Original Mortgage
$337,500
Outstanding Balance
$139,609
Interest Rate
6.78%
Mortgage Type
Stand Alone First
Estimated Equity
$1,141,351
Purchase Details
Closed on
Aug 17, 1998
Sold by
Venzon Karen M
Bought by
Venzon London P
Purchase Details
Closed on
Jul 27, 1995
Sold by
Lineback William S
Bought by
Venzon Menardo T and Venzon Carmen P
Home Financials for this Owner
Home Financials are based on the most recent Mortgage that was taken out on this home.
Original Mortgage
$182,850
Interest Rate
7.61%
Purchase Details
Closed on
Sep 11, 1993
Sold by
Lineback William S and Lineback Hazel
Bought by
Lineback William S and Lineback Hazel
Create a Home Valuation Report for This Property
The Home Valuation Report is an in-depth analysis detailing your home's value as well as a comparison with similar homes in the area
Home Values in the Area
Average Home Value in this Area
Purchase History
| Date | Buyer | Sale Price | Title Company |
|---|---|---|---|
| Venzon Menardo T | $90,000 | American Title Co | |
| Venzon London P | -- | Fidelity National Title Co | |
| Venzon Menardo T | $192,500 | Golden Bay Title Company | |
| Lineback William S | -- | -- |
Source: Public Records
Mortgage History
| Date | Status | Borrower | Loan Amount |
|---|---|---|---|
| Open | Venzon Menardo T | $337,500 | |
| Previous Owner | Venzon Menardo T | $182,850 |
Source: Public Records
Tax History Compared to Growth
Tax History
| Year | Tax Paid | Tax Assessment Tax Assessment Total Assessment is a certain percentage of the fair market value that is determined by local assessors to be the total taxable value of land and additions on the property. | Land | Improvement |
|---|---|---|---|---|
| 2025 | $5,288 | $395,223 | $118,176 | $284,047 |
| 2024 | $5,288 | $388,738 | $115,859 | $278,479 |
| 2023 | $5,136 | $386,608 | $113,588 | $273,020 |
| 2022 | $5,053 | $379,026 | $111,360 | $267,666 |
| 2021 | $4,934 | $371,596 | $109,177 | $262,419 |
| 2020 | $4,893 | $367,787 | $108,058 | $259,729 |
| 2019 | $4,841 | $360,577 | $105,940 | $254,637 |
| 2018 | $4,745 | $353,508 | $103,863 | $249,645 |
| 2017 | $4,628 | $346,578 | $101,827 | $244,751 |
| 2016 | $4,541 | $339,785 | $99,831 | $239,954 |
| 2015 | $4,473 | $334,682 | $98,332 | $236,350 |
| 2014 | $4,391 | $328,128 | $96,406 | $231,722 |
Source: Public Records
Map
Nearby Homes
- 5033 Blacksand Rd
- 4714 Serra Ave
- 4692 Nelson St
- 5330 Coco Palm Dr
- 39530 Dorrington Ct
- 4737 Boone Dr
- 4600 Nelson St
- 5589 Roosevelt Place
- 5580 Hemlock Terrace
- 4715 Mildred Dr
- 39090 Presidio Way Unit 237
- 5624 Chestnut Common
- 38976 Primula Terrace
- 38984 Primula Terrace
- 4840 Piper St
- 40116 Crockett St
- 39753 Placer Way
- 4715 Eggers Dr
- 5550 Higo Way
- 5562 Higo Way
- 39380 Blacow Rd
- 4987 Himalaya Common
- 4997 Himalaya Common
- 4977 Himalaya Common
- 39372 Blacow Rd
- 4890 Phelan Ave
- 39392 Blacow Rd
- 39385 Mariposa Way
- 4988 Himalaya Common
- 4998 Himalaya Common
- 39364 Blacow Rd
- 4978 Himalaya Common
- 4967 Himalaya Common
- 39377 Mariposa Way
- 4882 Phelan Ave
- 39356 Blacow Rd
- 4968 Himalaya Common
- 4933 Folsum Way
- 4925 Folsum Way
- 39369 Mariposa Way