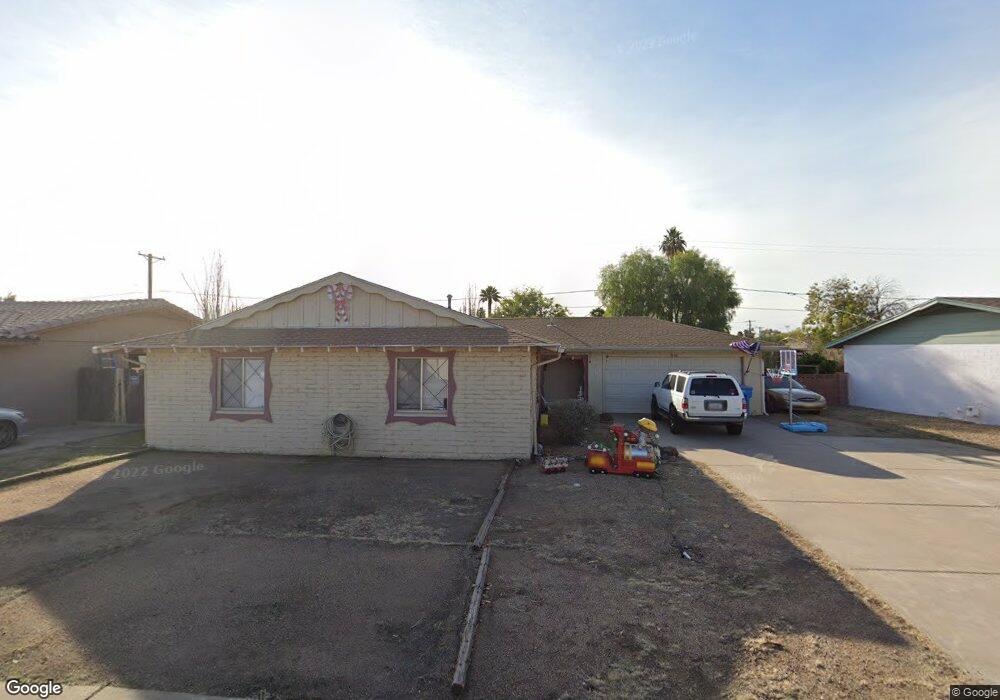
3939 W Glenn Dr Phoenix, AZ 85051
Alhambra NeighborhoodEstimated Value: $288,127 - $363,000
3
Beds
2
Baths
1,440
Sq Ft
$236/Sq Ft
Est. Value
About This Home
This home is located at 3939 W Glenn Dr, Phoenix, AZ 85051 and is currently estimated at $340,282, approximately $236 per square foot. 3939 W Glenn Dr is a home located in Maricopa County with nearby schools including Palo Verde Middle School, Roadrunner Elementary School, and Apollo High School.
Ownership History
Date
Name
Owned For
Owner Type
Purchase Details
Closed on
Jun 18, 2024
Sold by
Gorman Chris and Gorman Linda
Bought by
Gorman Family Trust and Gorman
Current Estimated Value
Purchase Details
Closed on
Jan 20, 2009
Sold by
Deutsche Bank National Trust Company
Bought by
Gorman Chris and Gorman Linda
Purchase Details
Closed on
Jan 16, 2008
Sold by
Muk Mary Chol Yol
Bought by
Deutsche Bank National Trust Co and Argent Securities Inc Asset Backed Pass
Purchase Details
Closed on
Jun 16, 2006
Sold by
Alell James Akot Allajab
Bought by
Muk Mary Chol Yol
Home Financials for this Owner
Home Financials are based on the most recent Mortgage that was taken out on this home.
Original Mortgage
$42,400
Interest Rate
6.57%
Mortgage Type
Stand Alone Second
Create a Home Valuation Report for This Property
The Home Valuation Report is an in-depth analysis detailing your home's value as well as a comparison with similar homes in the area
Home Values in the Area
Average Home Value in this Area
Purchase History
| Date | Buyer | Sale Price | Title Company |
|---|---|---|---|
| Gorman Family Trust | -- | None Listed On Document | |
| Gorman Chris | $49,500 | American Title Service Agenc | |
| Deutsche Bank National Trust Co | $181,584 | Security Title Agency | |
| Muk Mary Chol Yol | -- | Dhi Title Of Arizona Inc | |
| Muk Mary Chol Yol | $212,000 | Dhi Title Of Arizona Inc |
Source: Public Records
Mortgage History
| Date | Status | Borrower | Loan Amount |
|---|---|---|---|
| Previous Owner | Muk Mary Chol Yol | $42,400 | |
| Previous Owner | Muk Mary Chol Yol | $169,600 |
Source: Public Records
Tax History Compared to Growth
Tax History
| Year | Tax Paid | Tax Assessment Tax Assessment Total Assessment is a certain percentage of the fair market value that is determined by local assessors to be the total taxable value of land and additions on the property. | Land | Improvement |
|---|---|---|---|---|
| 2025 | $994 | $8,128 | -- | -- |
| 2024 | $976 | $7,741 | -- | -- |
| 2023 | $976 | $24,100 | $4,820 | $19,280 |
| 2022 | $944 | $18,430 | $3,680 | $14,750 |
| 2021 | $956 | $16,710 | $3,340 | $13,370 |
| 2020 | $932 | $15,360 | $3,070 | $12,290 |
| 2019 | $915 | $13,430 | $2,680 | $10,750 |
| 2018 | $891 | $12,350 | $2,470 | $9,880 |
| 2017 | $887 | $10,760 | $2,150 | $8,610 |
| 2016 | $871 | $10,010 | $2,000 | $8,010 |
| 2015 | $807 | $9,360 | $1,870 | $7,490 |
Source: Public Records
Map
Nearby Homes
- 4022 W Glenn Dr
- 4039 W Glenn Dr
- 4015 W Solar Dr
- 3933 W Myrtle Ave
- 3842 W Ocotillo Rd
- 6807 N 37th Dr
- 3631 W Myrtle Ave
- 6707 N 42nd Ave
- 3913 W Krall St
- 7326 N 43rd Ave
- 7200 N 43rd Ave Unit 82
- 7338 N 43rd Ave
- 4020 W Tuckey Ln
- 7344 N 43rd Ave
- 7601 N 40th Dr
- 7101 N 36th Ave Unit 102
- 7320 N 44th Ave
- 4345 W State Ave
- 7432 N 43rd Ln
- 4238 W Krall St
- 4001 W Glenn Dr
- 3935 W Glenn Dr
- 3936 W Solar Dr
- 3940 W Solar Dr
- 4007 W Glenn Dr
- 3931 W Glenn Dr
- 3940 W Glenn Dr
- 3938 W Glenn Dr
- 3932 W Solar Dr
- 4002 W Glenn Dr
- 3944 W Solar Dr
- 3934 W Glenn Dr
- 4008 W Glenn Dr
- 4013 W Glenn Dr
- 3927 W Glenn Dr
- 3928 W Solar Dr
- 3932 W Glenn Dr
- 3950 W Solar Dr
- 3939 W Palmaire Dr
- 3939 W Solar Dr