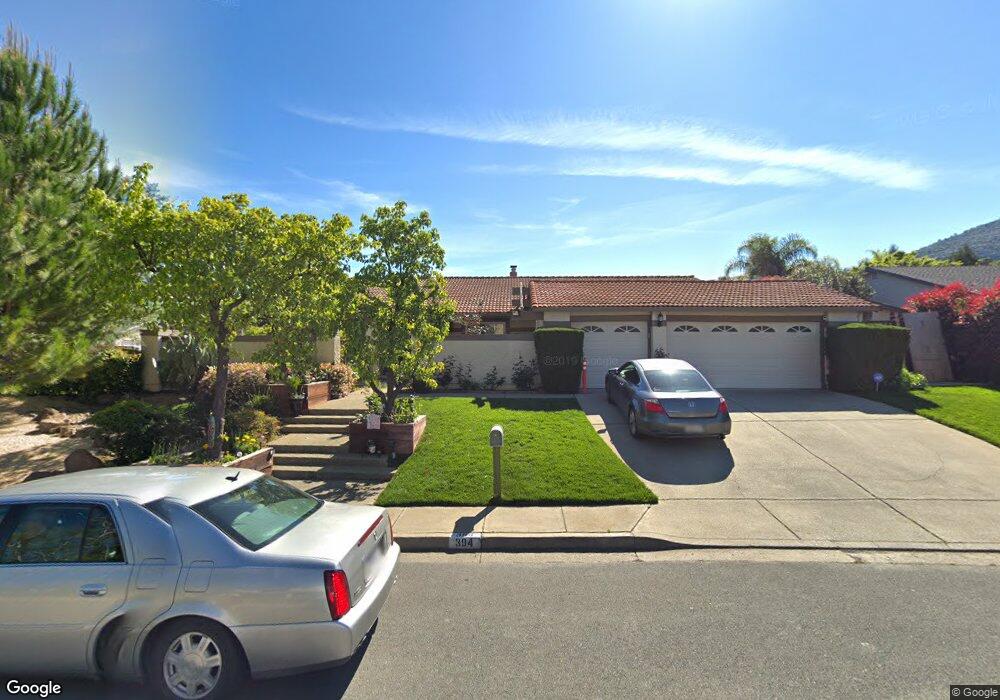
394 Mt Sequoia Place Clayton, CA 94517
Estimated Value: $1,134,343 - $1,175,000
4
Beds
2
Baths
2,325
Sq Ft
$496/Sq Ft
Est. Value
About This Home
This home is located at 394 Mt Sequoia Place, Clayton, CA 94517 and is currently estimated at $1,153,336, approximately $496 per square foot. 394 Mt Sequoia Place is a home located in Contra Costa County with nearby schools including Mt. Diablo Elementary School, Diablo View Middle School, and College Park High School.
Ownership History
Date
Name
Owned For
Owner Type
Purchase Details
Closed on
Nov 17, 2015
Sold by
Gonzalez Rafael and Gonzalez Reyna
Bought by
The Gonzalez Family Living Trust
Current Estimated Value
Home Financials for this Owner
Home Financials are based on the most recent Mortgage that was taken out on this home.
Original Mortgage
$300,000
Outstanding Balance
$235,482
Interest Rate
3.73%
Mortgage Type
New Conventional
Estimated Equity
$917,854
Purchase Details
Closed on
Jul 11, 2006
Sold by
Gonzalez Rafael and Gonzalez Reyna
Bought by
Gonzalez Rafael and Gonzalez Reyna
Purchase Details
Closed on
Mar 23, 1995
Sold by
Small Ivan R and Small Carolyn B
Bought by
Gonzalez Rafael and Gonzalez Reyna
Home Financials for this Owner
Home Financials are based on the most recent Mortgage that was taken out on this home.
Original Mortgage
$325,200
Interest Rate
8.81%
Mortgage Type
Purchase Money Mortgage
Create a Home Valuation Report for This Property
The Home Valuation Report is an in-depth analysis detailing your home's value as well as a comparison with similar homes in the area
Home Values in the Area
Average Home Value in this Area
Purchase History
| Date | Buyer | Sale Price | Title Company |
|---|---|---|---|
| The Gonzalez Family Living Trust | -- | Old Republic Title Company | |
| Gonzalez Rafael | -- | Old Republic Title Company | |
| Gonzalez Rafael | -- | None Available | |
| Gonzalez Rafael | $281,500 | Chicago Title Company |
Source: Public Records
Mortgage History
| Date | Status | Borrower | Loan Amount |
|---|---|---|---|
| Open | Gonzalez Rafael | $300,000 | |
| Closed | Gonzalez Rafael | $325,200 |
Source: Public Records
Tax History
| Year | Tax Paid | Tax Assessment Tax Assessment Total Assessment is a certain percentage of the fair market value that is determined by local assessors to be the total taxable value of land and additions on the property. | Land | Improvement |
|---|---|---|---|---|
| 2025 | $6,492 | $472,805 | $159,554 | $313,251 |
| 2024 | $6,193 | $463,535 | $156,426 | $307,109 |
| 2023 | $6,193 | $454,447 | $153,359 | $301,088 |
| 2022 | $6,097 | $445,537 | $150,352 | $295,185 |
| 2021 | $5,938 | $436,802 | $147,404 | $289,398 |
| 2019 | $5,812 | $423,848 | $143,033 | $280,815 |
| 2018 | $5,590 | $415,538 | $140,229 | $275,309 |
| 2017 | $5,401 | $407,391 | $137,480 | $269,911 |
| 2016 | $5,243 | $399,404 | $134,785 | $264,619 |
| 2015 | $5,171 | $393,406 | $132,761 | $260,645 |
| 2014 | $5,070 | $385,701 | $130,161 | $255,540 |
Source: Public Records
Map
Nearby Homes
- 711 Bloching Cir
- 186 Mt Wilson Way
- 152 Regency Dr
- 367 Mt Washington Way
- 218 Mountaire Cir
- 242 El Pueblo Place
- 55 La Honda Ct
- 314 Semillon Cir
- 249 Stranahan Cir
- 5849 Mitchell Canyon Ct
- 5795 Lewis Way
- 5817 Mitchell Canyon Ct
- 1161 Torrey Pines Place
- 1025 Panadero Way
- 1000 Froyd Rd
- 5 Pardi Ln
- 1267 Quiet Cir
- 5535 Merritt Dr
- 5565 Jasper Ct
- 5565 Banff Ct
- 390 Mt Sequoia Place
- 252 Mountaire Pkwy
- 256 Mountaire Pkwy
- 395 Mt Sequoia Place
- 402 Mt Sequoia Ct
- 391 Mt Sequoia Place
- 386 Mt Sequoia Place
- 604 Mt Duncan Dr
- 260 Mountaire Pkwy
- 403 Mt Sequoia Ct
- 387 Mt Sequoia Place
- 240 Mountaire Pkwy
- 255 Mountaire Pkwy
- 259 Mountaire Pkwy
- 382 Mt Sequoia Place
- 247 Mountaire Pkwy
- 264 Mountaire Pkwy
- 407 Mt Sequoia Ct
- 383 Mt Sequoia Place
- 263 Mountaire Pkwy
Your Personal Tour Guide
Ask me questions while you tour the home.