S
Landlord's Agent in 2024
Shant Koutoujian
New Wave Boston Real Estate, LLC
(617) 259-1760
1 Total Sale
Estimated Value: $477,000 - $754,784
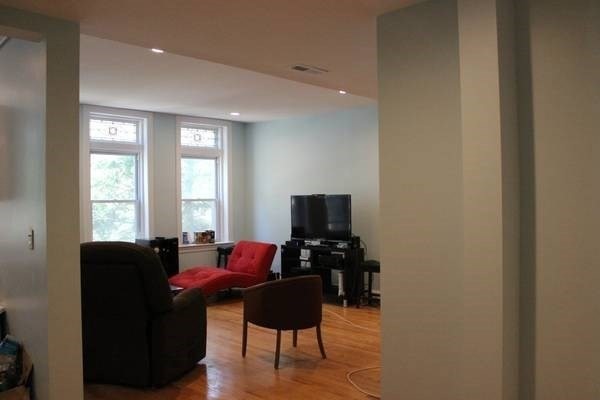
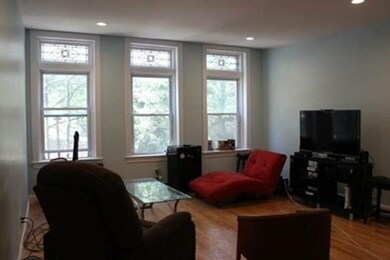
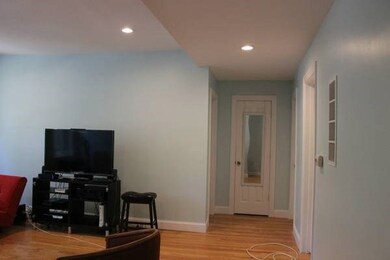
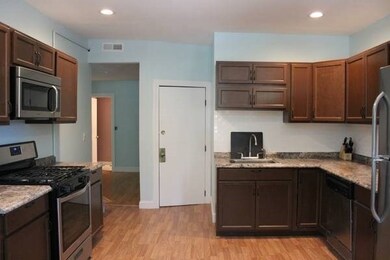
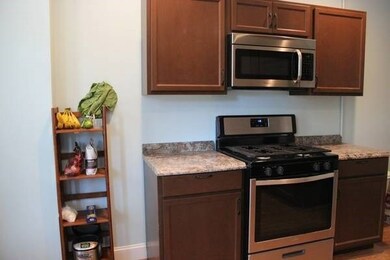
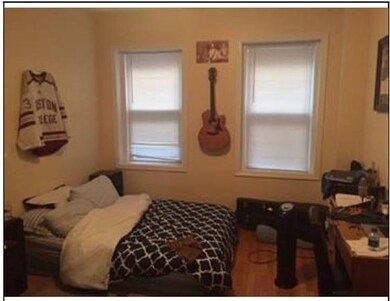
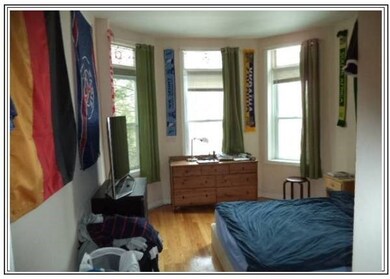
Huge 3 bedroom condo in the Fenway/Mission Hill neighborhood! This spacious unit features hardwood floors throughout, three large bedrooms and bright spacious living room, big renovated eat-in kitchen with stainless steel appliances (dishwasher, stove, microwave, fridge), lots of natural light, walk-in closets, and in a well-maintained building with laundry! Ideal for students and professionals in the area looking for easy T access, and proximity to Northeastern, Wentworth, Longwood, Mass Art, MCPHS, and much more!
Last Agent to Rent the Property
New Wave Boston Real Estate, LLC Listed on: 03/24/2024
| Date | Buyer | Sale Price | Title Company |
|---|---|---|---|
| Patel Surbhi | $350,000 | -- | |
| Patel Deepti | $350,000 | -- | |
| Patel Deepti | $350,000 | -- | |
| Leung David S | $144,000 | -- |
| Date | Status | Borrower | Loan Amount |
|---|---|---|---|
| Open | Patel Surbhi | $184,000 | |
| Previous Owner | Patel Deepti | $231,000 | |
| Previous Owner | Leung David S | $223,000 |
| Date | Event | Price | List to Sale | Price per Sq Ft |
|---|---|---|---|---|
| 04/09/2025 04/09/25 | Off Market | $3,200 | -- | -- |
| 03/06/2025 03/06/25 | For Rent | $3,200 | 0.0% | -- |
| 03/06/2025 03/06/25 | Price Changed | $3,200 | +14.3% | $3 / Sq Ft |
| 11/15/2024 11/15/24 | Off Market | $2,800 | -- | -- |
| 09/30/2024 09/30/24 | For Rent | $2,800 | -37.8% | -- |
| 05/15/2024 05/15/24 | Rented | $4,500 | 0.0% | -- |
| 05/15/2024 05/15/24 | Under Contract | -- | -- | -- |
| 04/24/2024 04/24/24 | Price Changed | $4,500 | -6.3% | $3 / Sq Ft |
| 03/24/2024 03/24/24 | For Rent | $4,800 | +35.2% | -- |
| 04/22/2021 04/22/21 | Rented | $3,550 | 0.0% | -- |
| 04/22/2021 04/22/21 | Under Contract | -- | -- | -- |
| 03/06/2021 03/06/21 | For Rent | $3,550 | +18.3% | -- |
| 07/23/2016 07/23/16 | Rented | $3,000 | 0.0% | -- |
| 07/14/2016 07/14/16 | Under Contract | -- | -- | -- |
| 07/12/2016 07/12/16 | Price Changed | $3,000 | -6.3% | $2 / Sq Ft |
| 06/23/2016 06/23/16 | For Rent | $3,200 | -- | -- |
| Year | Tax Paid | Tax Assessment Tax Assessment Total Assessment is a certain percentage of the fair market value that is determined by local assessors to be the total taxable value of land and additions on the property. | Land | Improvement |
|---|---|---|---|---|
| 2025 | $8,301 | $716,800 | $0 | $716,800 |
| 2024 | $7,699 | $706,300 | $0 | $706,300 |
| 2023 | $7,359 | $685,200 | $0 | $685,200 |
| 2022 | $7,311 | $672,000 | $0 | $672,000 |
| 2021 | $7,030 | $658,900 | $0 | $658,900 |
| 2020 | $6,099 | $577,600 | $0 | $577,600 |
| 2019 | $5,692 | $540,000 | $0 | $540,000 |
| 2018 | $5,241 | $500,100 | $0 | $500,100 |
| 2017 | $5,041 | $476,000 | $0 | $476,000 |
| 2016 | $4,987 | $453,400 | $0 | $453,400 |
| 2015 | $5,302 | $437,800 | $0 | $437,800 |
| 2014 | $5,003 | $397,700 | $0 | $397,700 |
S
Landlord's Agent in 2024
Shant Koutoujian
New Wave Boston Real Estate, LLC
(617) 259-1760
1 Total Sale
N
Buyer's Agent in 2021
Nicole Crichlow
Red Tree Real Estate
B
Seller's Agent in 2016
Brandon Gonsalves
Keller Williams Realty Boston South West
Source: MLS Property Information Network (MLS PIN)
MLS Number: 73215919
APN: JAMA-000000-000010-000306-000014
Disclaimer: Certain information contained herein is derived from information provided by parties other than Homes.com. All information provided is deemed reliable, but is not guaranteed to be accurate and should be independently verified.
![]() The property listing data and information, or the Images, set forth herein were provided to MLS Property Information Network, Inc. from third party sources, including sellers, lessors and public records, and were compiled by MLS Property Information Network, Inc. The property listing data and information, and the Images, are for the personal, non-commercial use of consumers having a good faith interest in purchasing or leasing listed properties of the type displayed to them and may not be used for any purpose other than to identify prospective properties which such consumers may have a good faith interest in purchasing or leasing. MLS Property Information Network, Inc. and its subscribers disclaim any and all representations and warranties as to the accuracy of the property listing data and information, or as to the accuracy of any of the Images, set forth herein.
The property listing data and information, or the Images, set forth herein were provided to MLS Property Information Network, Inc. from third party sources, including sellers, lessors and public records, and were compiled by MLS Property Information Network, Inc. The property listing data and information, and the Images, are for the personal, non-commercial use of consumers having a good faith interest in purchasing or leasing listed properties of the type displayed to them and may not be used for any purpose other than to identify prospective properties which such consumers may have a good faith interest in purchasing or leasing. MLS Property Information Network, Inc. and its subscribers disclaim any and all representations and warranties as to the accuracy of the property listing data and information, or as to the accuracy of any of the Images, set forth herein.
