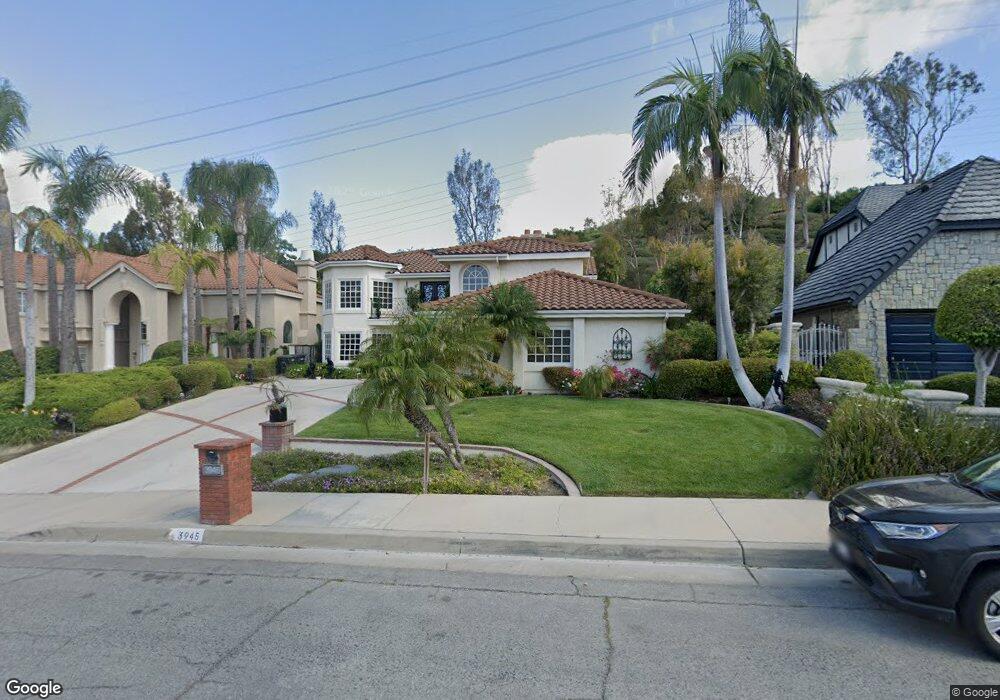
3945 E Rolling Green Ln Orange, CA 92867
Estimated Value: $2,051,000 - $2,321,000
5
Beds
4
Baths
3,959
Sq Ft
$541/Sq Ft
Est. Value
About This Home
This home is located at 3945 E Rolling Green Ln, Orange, CA 92867 and is currently estimated at $2,141,358, approximately $540 per square foot. 3945 E Rolling Green Ln is a home located in Orange County with nearby schools including Serrano Elementary School, Cerro Villa Middle School, and Villa Park High School.
Ownership History
Date
Name
Owned For
Owner Type
Purchase Details
Closed on
Sep 21, 2004
Sold by
Schneier Neal and Rothi Diane
Bought by
Semain Raymond and Semain Margaret
Current Estimated Value
Home Financials for this Owner
Home Financials are based on the most recent Mortgage that was taken out on this home.
Original Mortgage
$768,000
Interest Rate
4.36%
Mortgage Type
Purchase Money Mortgage
Purchase Details
Closed on
Dec 12, 2000
Sold by
Dolan Michael G and Palmer Marianne C
Bought by
Schneier Neal and Rothi Diane
Home Financials for this Owner
Home Financials are based on the most recent Mortgage that was taken out on this home.
Original Mortgage
$516,000
Interest Rate
7.41%
Purchase Details
Closed on
Jan 29, 1996
Sold by
Miller Malcolm G
Bought by
Dolan Michael G and Palmer Marianne C
Home Financials for this Owner
Home Financials are based on the most recent Mortgage that was taken out on this home.
Original Mortgage
$424,000
Interest Rate
7.1%
Create a Home Valuation Report for This Property
The Home Valuation Report is an in-depth analysis detailing your home's value as well as a comparison with similar homes in the area
Home Values in the Area
Average Home Value in this Area
Purchase History
| Date | Buyer | Sale Price | Title Company |
|---|---|---|---|
| Semain Raymond | $960,000 | Landwood Title Company | |
| Schneier Neal | $645,000 | Orange Coast Title | |
| Dolan Michael G | $530,000 | Orange Coast Title Company |
Source: Public Records
Mortgage History
| Date | Status | Borrower | Loan Amount |
|---|---|---|---|
| Previous Owner | Semain Raymond | $768,000 | |
| Previous Owner | Schneier Neal | $516,000 | |
| Previous Owner | Dolan Michael G | $424,000 |
Source: Public Records
Tax History
| Year | Tax Paid | Tax Assessment Tax Assessment Total Assessment is a certain percentage of the fair market value that is determined by local assessors to be the total taxable value of land and additions on the property. | Land | Improvement |
|---|---|---|---|---|
| 2025 | $14,264 | $1,338,153 | $847,441 | $490,712 |
| 2024 | $14,264 | $1,311,915 | $830,824 | $481,091 |
| 2023 | $13,954 | $1,286,192 | $814,534 | $471,658 |
| 2022 | $13,689 | $1,260,973 | $798,563 | $462,410 |
| 2021 | $13,301 | $1,236,249 | $782,905 | $453,344 |
| 2020 | $13,180 | $1,223,573 | $774,877 | $448,696 |
| 2019 | $13,009 | $1,199,582 | $759,683 | $439,899 |
| 2018 | $12,810 | $1,176,061 | $744,787 | $431,274 |
| 2017 | $12,267 | $1,153,001 | $730,183 | $422,818 |
| 2016 | $12,028 | $1,130,394 | $715,866 | $414,528 |
| 2015 | $11,854 | $1,113,415 | $705,113 | $408,302 |
| 2014 | $10,465 | $981,552 | $607,959 | $373,593 |
Source: Public Records
Map
Nearby Homes
- 4011 E Green Clover Cir
- 3624 E Shallow Brook Ln
- 18605 Villa Dr
- 18262 Pamela Place
- 9531 Lemon St
- 18782 Peppertree Dr
- 9312 Smoketree Ln
- 2910 E Shady Forest Ln
- 18411 Hillcrest Ave
- 18811 Ridgeview Cir
- 18221 Windsor Dr
- 656 S Andover Dr
- 640 S Londerry Ln
- 18301 Churchill Ln
- 2076 N Mori Ln
- 1972 N Fern St
- 10041 Sycamore St
- 2225 E Grove Ave
- 18162 Stratford Cir
- 415 S Brook Ln
- 3933 E Rolling Green Ln
- 4005 E Rolling Green Ln
- 3921 E Rolling Green Ln
- 4017 E Rolling Green Ln
- 3911 E Rolling Green Ln
- 4027 E Rolling Green Ln
- 3948 E Rolling Green Ln
- 3936 E Rolling Green Ln
- 3924 E Rolling Green Ln
- 4012 E Rolling Green Ln
- 3847 E Rolling Green Ln
- 3912 E Rolling Green Ln
- 4022 E Rolling Green Ln
- 4038 E Rolling Green Ln
- 3835 E Rolling Green Ln
- 4045 E Rolling Green Ln
- 3849 E Summitridge Ln
- 4104 E Rolling Green Ln
- 3825 E Rolling Green Ln
- 3940 E Summitridge Ln
Your Personal Tour Guide
Ask me questions while you tour the home.