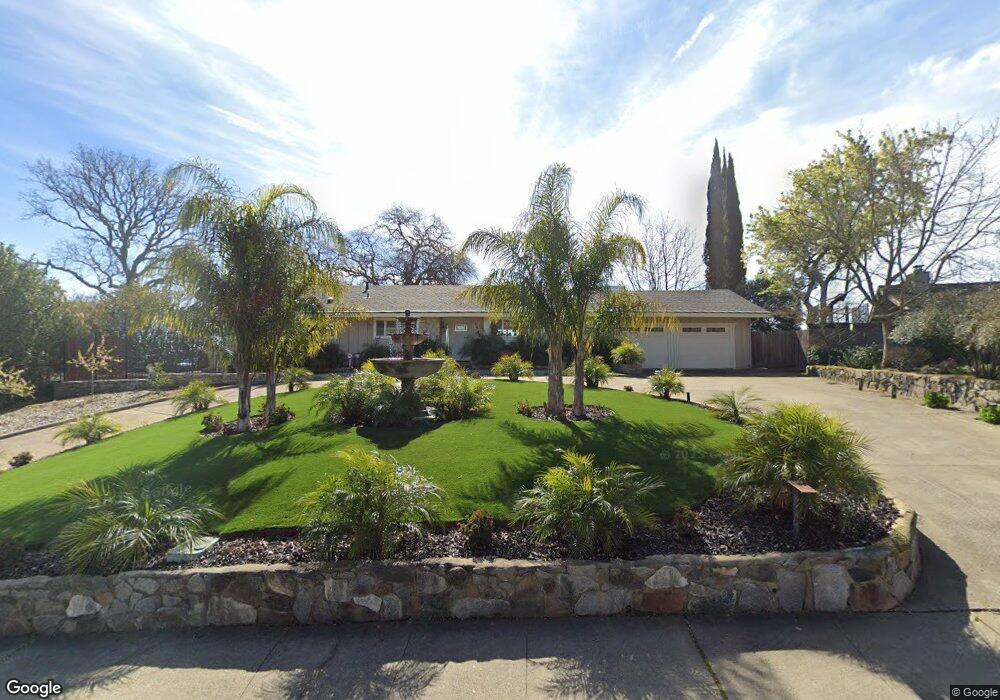
3946 Oak Hurst Cir Fair Oaks, CA 95628
Estimated Value: $669,772 - $806,000
3
Beds
3
Baths
1,844
Sq Ft
$388/Sq Ft
Est. Value
About This Home
This home is located at 3946 Oak Hurst Cir, Fair Oaks, CA 95628 and is currently estimated at $714,693, approximately $387 per square foot. 3946 Oak Hurst Cir is a home located in Sacramento County with nearby schools including Carmichael Elementary School, John Barrett Middle School, and Del Campo High School.
Ownership History
Date
Name
Owned For
Owner Type
Purchase Details
Closed on
May 17, 2019
Sold by
Strader Michelle Susan
Bought by
Strader Scott P
Current Estimated Value
Home Financials for this Owner
Home Financials are based on the most recent Mortgage that was taken out on this home.
Original Mortgage
$480,000
Outstanding Balance
$421,160
Interest Rate
4.1%
Mortgage Type
New Conventional
Estimated Equity
$293,533
Purchase Details
Closed on
May 14, 2019
Sold by
Lukens Family Trust
Bought by
Strader Scott P
Home Financials for this Owner
Home Financials are based on the most recent Mortgage that was taken out on this home.
Original Mortgage
$480,000
Outstanding Balance
$421,160
Interest Rate
4.1%
Mortgage Type
New Conventional
Estimated Equity
$293,533
Purchase Details
Closed on
Feb 5, 2019
Sold by
Lukens Rita M and Lukens Family Trust
Bought by
Lukens Klobas Mary K and Lukens Family Trust
Purchase Details
Closed on
Aug 9, 2000
Sold by
Lukens Rita M
Bought by
Lukens Rita M and Lukens Family Trust
Create a Home Valuation Report for This Property
The Home Valuation Report is an in-depth analysis detailing your home's value as well as a comparison with similar homes in the area
Home Values in the Area
Average Home Value in this Area
Purchase History
| Date | Buyer | Sale Price | Title Company |
|---|---|---|---|
| Strader Scott P | -- | Fidelity National Title Co | |
| Strader Scott P | $600,000 | Fidelity National Title Co | |
| Lukens Klobas Mary K | -- | None Available | |
| Lukens Rita M | -- | -- | |
| Lukens Rita M | -- | -- |
Source: Public Records
Mortgage History
| Date | Status | Borrower | Loan Amount |
|---|---|---|---|
| Open | Strader Scott P | $480,000 |
Source: Public Records
Tax History
| Year | Tax Paid | Tax Assessment Tax Assessment Total Assessment is a certain percentage of the fair market value that is determined by local assessors to be the total taxable value of land and additions on the property. | Land | Improvement |
|---|---|---|---|---|
| 2025 | $8,063 | $669,306 | $172,902 | $496,404 |
| 2024 | $8,063 | $656,183 | $169,512 | $486,671 |
| 2023 | $7,829 | $643,318 | $166,189 | $477,129 |
| 2022 | $7,800 | $630,705 | $162,931 | $467,774 |
| 2021 | $7,649 | $618,339 | $159,737 | $458,602 |
| 2020 | $7,540 | $612,000 | $158,100 | $453,900 |
| 2019 | $1,570 | $131,482 | $37,552 | $93,930 |
| 2018 | $1,534 | $128,905 | $36,816 | $92,089 |
| 2017 | $1,517 | $126,379 | $36,095 | $90,284 |
| 2016 | $1,418 | $123,902 | $35,388 | $88,514 |
| 2015 | $1,392 | $122,042 | $34,857 | $87,185 |
| 2014 | $1,362 | $119,660 | $34,182 | $85,478 |
Source: Public Records
Map
Nearby Homes
- 3937 Orangewood Dr
- 0 Ridge St Unit 225129517
- 0 Ridge St Unit 224054501
- 11334 Mother Lode Cir
- 4215 New York Ave
- 8044 Sacramento St
- 11224 Sauk River Ct
- 4291 Watkins Dr
- 11316 Gold Country Blvd
- 11305 Sutters Mill Cir
- 4134 Bannister Rd
- 2129 Promontory Point Ln
- 11287 Crocker Grove Ln
- 11360 Gold Country Blvd
- 3909 Edgevale Ct
- 7731 Winding Way
- 4134-lot 1 Bannister Rd
- 11150 Trinity River Dr Unit 101
- 11150 Trinity River Dr Unit 59
- 11150 Trinity River Dr Unit 124
- 3942 Oak Hurst Cir
- 3950 Oak Hurst Cir
- 3939 Oak Hurst Cir
- 3954 Oak Hurst Cir
- 3949 Oak Hurst Cir
- 3938 Oak Hurst Cir
- 3920 Valley View Ct
- 3910 Valley View Ct
- 3925 Oak Hurst Cir
- 3959 Oak Hurst Cir
- 3934 Oak Hurst Cir
- 3900 Valley View Ct
- 3930 Oak Hurst Cir
- 3921 Oak Hurst Cir
- 3926 Oak Hurst Cir
- 3963 Oak Hurst Cir
- 3930 Valley View Ct
- 3922 Oak Hurst Cir
- 3911 Valley View Ct
- 3921 Valley View Ct
Your Personal Tour Guide
Ask me questions while you tour the home.