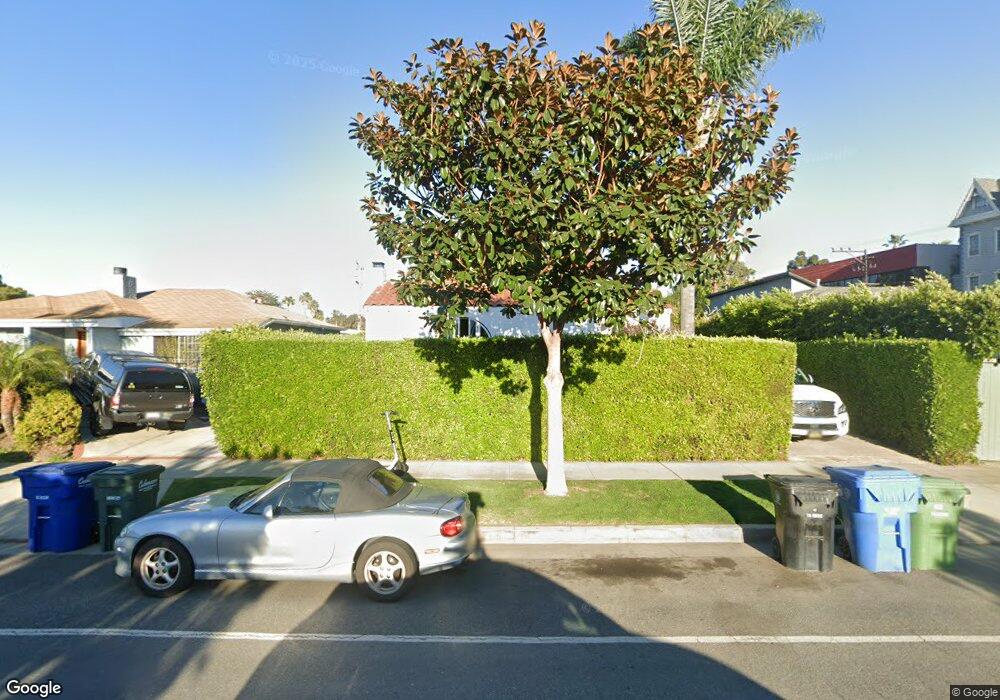
3946 Walgrove Ave Los Angeles, CA 90066
Del Rey NeighborhoodEstimated Value: $1,392,000 - $1,704,000
3
Beds
2
Baths
1,562
Sq Ft
$1,015/Sq Ft
Est. Value
About This Home
This home is located at 3946 Walgrove Ave, Los Angeles, CA 90066 and is currently estimated at $1,584,842, approximately $1,014 per square foot. 3946 Walgrove Ave is a home located in Los Angeles County with nearby schools including La Ballona Elementary School, Culver City Middle School, and Culver City High School.
Ownership History
Date
Name
Owned For
Owner Type
Purchase Details
Closed on
Feb 26, 2002
Sold by
Rifkin Andrew P
Bought by
Rifkin Andrew P and Rifkin Dodie
Current Estimated Value
Purchase Details
Closed on
Dec 27, 2001
Sold by
Rifkin Andrew P
Bought by
Rifkin Andrew P and Rifkin Dodi
Home Financials for this Owner
Home Financials are based on the most recent Mortgage that was taken out on this home.
Original Mortgage
$204,500
Interest Rate
6.73%
Purchase Details
Closed on
Jul 3, 2001
Sold by
Rifkin Andrew P
Bought by
Rifkin Andrew P and Rifkin Dodie
Purchase Details
Closed on
Oct 23, 1996
Sold by
Sestay Joseph S
Bought by
Rifkin Andrew P
Home Financials for this Owner
Home Financials are based on the most recent Mortgage that was taken out on this home.
Original Mortgage
$207,950
Interest Rate
7.67%
Purchase Details
Closed on
Sep 1, 1993
Sold by
Burnside John Harvey
Bought by
Sestay Joseph S
Home Financials for this Owner
Home Financials are based on the most recent Mortgage that was taken out on this home.
Original Mortgage
$174,000
Interest Rate
4.75%
Create a Home Valuation Report for This Property
The Home Valuation Report is an in-depth analysis detailing your home's value as well as a comparison with similar homes in the area
Home Values in the Area
Average Home Value in this Area
Purchase History
| Date | Buyer | Sale Price | Title Company |
|---|---|---|---|
| Rifkin Andrew P | -- | Fidelity National Title Co | |
| Rifkin Andrew P | -- | Fidelity National Title Co | |
| Rifkin Andrew P | -- | -- | |
| Rifkin Andrew P | $260,000 | Equity Title Co | |
| Sestay Joseph S | $224,500 | Equity Title |
Source: Public Records
Mortgage History
| Date | Status | Borrower | Loan Amount |
|---|---|---|---|
| Closed | Rifkin Andrew P | $204,500 | |
| Previous Owner | Rifkin Andrew P | $207,950 | |
| Previous Owner | Sestay Joseph S | $174,000 |
Source: Public Records
Tax History
| Year | Tax Paid | Tax Assessment Tax Assessment Total Assessment is a certain percentage of the fair market value that is determined by local assessors to be the total taxable value of land and additions on the property. | Land | Improvement |
|---|---|---|---|---|
| 2025 | $6,400 | $423,431 | $264,322 | $159,109 |
| 2024 | $6,400 | $415,130 | $259,140 | $155,990 |
| 2023 | $6,157 | $406,991 | $254,059 | $152,932 |
| 2022 | $5,855 | $399,012 | $249,078 | $149,934 |
| 2021 | $5,766 | $391,190 | $244,195 | $146,995 |
| 2020 | $5,631 | $387,180 | $241,692 | $145,488 |
| 2019 | $5,504 | $379,589 | $236,953 | $142,636 |
| 2018 | $5,268 | $372,147 | $232,307 | $139,840 |
| 2016 | $4,877 | $357,698 | $223,287 | $134,411 |
| 2015 | $4,801 | $352,327 | $219,934 | $132,393 |
| 2014 | $4,834 | $345,426 | $215,626 | $129,800 |
Source: Public Records
Map
Nearby Homes
- 3932 Glencoe Ave
- 13320 Beach Ave Unit 304
- 13320 Beach Ave Unit 202
- 4050 Glencoe Ave Unit 423
- 3867 Lyceum Ave
- 4060 Glencoe Ave Unit 231
- 4060 Glencoe Ave Unit 222
- 4060 Glencoe Ave Unit 204
- 4021 Beethoven St
- 3917 Beethoven St
- 4080 Glencoe Ave Unit 226
- 3981 Moore St Unit 101
- 4080 Alla Rd
- 3900 Beethoven St Unit 302
- 4066 Lyceum Ave
- 13461 Beach Ave
- 2403 Louella Ave
- 3794 Rosewood Ave
- 13013 Venice Blvd
- 2445 Glyndon Ave
- 3940 Walgrove Ave
- 3948 Walgrove Ave
- 3952 Walgrove Ave
- 3936 Walgrove Ave
- 3932 Walgrove Ave Unit 3932 Walgrove Ave Unit A
- 3932 Walgrove Ave
- 3945 Redwood Ave
- 3941 Redwood Ave
- 3949 Redwood Ave
- 3937 Redwood Ave
- 3945 Walgrove Ave
- 3941 Walgrove Ave
- 3930 Walgrove Ave
- 3949 Walgrove Ave
- 3937 Walgrove Ave
- 3933 Redwood Ave
- 3933 Walgrove Ave
- 3931 Redwood Ave
- 3926 Walgrove Ave
Your Personal Tour Guide
Ask me questions while you tour the home.