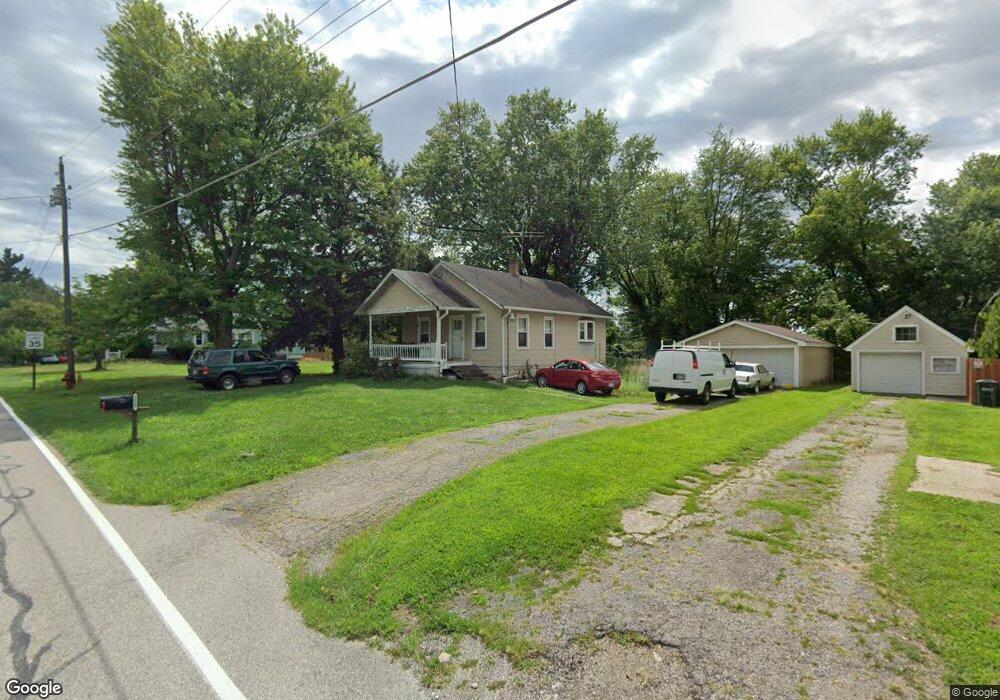
3947 Fulton Grove Rd Cincinnati, OH 45245
Estimated Value: $133,000 - $217,000
1
Bed
1
Bath
768
Sq Ft
$211/Sq Ft
Est. Value
About This Home
This home is located at 3947 Fulton Grove Rd, Cincinnati, OH 45245 and is currently estimated at $162,336, approximately $211 per square foot. 3947 Fulton Grove Rd is a home located in Clermont County with nearby schools including Withamsville-Tobasco Elementary School, West Clermont Middle School, and West Clermont High School.
Ownership History
Date
Name
Owned For
Owner Type
Purchase Details
Closed on
Apr 25, 2006
Sold by
Awad Michael E and Awad Richard T
Bought by
Day Cydney R
Current Estimated Value
Home Financials for this Owner
Home Financials are based on the most recent Mortgage that was taken out on this home.
Original Mortgage
$64,706
Outstanding Balance
$37,206
Interest Rate
6.37%
Mortgage Type
FHA
Estimated Equity
$125,130
Purchase Details
Closed on
Apr 13, 1999
Sold by
Est Sr George W Peters
Bought by
Awad Michael E and Awad Richard T
Home Financials for this Owner
Home Financials are based on the most recent Mortgage that was taken out on this home.
Original Mortgage
$33,000
Interest Rate
6.94%
Mortgage Type
New Conventional
Purchase Details
Closed on
Aug 24, 1993
Purchase Details
Closed on
Mar 1, 1989
Create a Home Valuation Report for This Property
The Home Valuation Report is an in-depth analysis detailing your home's value as well as a comparison with similar homes in the area
Home Values in the Area
Average Home Value in this Area
Purchase History
| Date | Buyer | Sale Price | Title Company |
|---|---|---|---|
| Day Cydney R | $75,000 | Advanced Land Title Agency | |
| Awad Michael E | $63,000 | -- | |
| -- | $28,000 | -- | |
| -- | $46,100 | -- |
Source: Public Records
Mortgage History
| Date | Status | Borrower | Loan Amount |
|---|---|---|---|
| Open | Day Cydney R | $64,706 | |
| Previous Owner | Awad Michael E | $33,000 |
Source: Public Records
Tax History Compared to Growth
Tax History
| Year | Tax Paid | Tax Assessment Tax Assessment Total Assessment is a certain percentage of the fair market value that is determined by local assessors to be the total taxable value of land and additions on the property. | Land | Improvement |
|---|---|---|---|---|
| 2024 | $1,747 | $34,620 | $11,800 | $22,820 |
| 2023 | $1,750 | $34,620 | $11,800 | $22,820 |
| 2022 | $1,525 | $26,150 | $8,820 | $17,330 |
| 2021 | $1,531 | $26,150 | $8,820 | $17,330 |
| 2020 | $1,532 | $26,150 | $8,820 | $17,330 |
| 2019 | $1,156 | $23,070 | $8,400 | $14,670 |
| 2018 | $1,167 | $23,070 | $8,400 | $14,670 |
| 2017 | $1,290 | $23,070 | $8,400 | $14,670 |
| 2016 | $1,290 | $23,070 | $8,400 | $14,670 |
| 2015 | $1,251 | $23,070 | $8,400 | $14,670 |
| 2014 | $1,251 | $23,070 | $8,400 | $14,670 |
| 2013 | $1,307 | $23,840 | $8,400 | $15,440 |
Source: Public Records
Map
Nearby Homes
- 3963 Pharo Dr
- 671 Mccormick Ln
- 670 Mccormick Ln
- 4067 Glen Este-Withamsville Rd
- 3963 Benjamin St
- 915 Ohio Pike
- 686 Loda Dr
- 685 Hillview Dr
- 3927 Youngman Dr
- 604 Legend Hills
- 642 Springs Ln
- 4129 Forsythia Dr
- 3921 Randolph Ln
- 921 Country Club Dr
- 933 Country Club Dr
- 3805 9 Mile Rd
- 3879 Mark Ct
- 595 Davis Rd
- 990 Vixen Dr
- 4165 S Gensen Loop
- 3951 Fulton Grove Rd
- 3941 Fulton Grove Rd
- 3948 Fulton Grove Rd
- 3955 Fulton Grove Rd
- 3954 Fulton Grove Rd
- 774 Connie Ln
- 773 Connie Ln
- 3944 Fulton Grove Rd
- 3956 Fulton Grove Rd
- 3959 Fulton Grove Rd
- 3937 Fulton Grove Rd
- 774 Gerald Ct
- 791 Lilly Ln
- 774 Jerald Ct
- 3960 Fulton Grove Rd
- 769 Connie Ln
- 790 Lilly Ln
- 3954 Beverly Dr
- 3942 Beverly Dr
- 3938 Fulton Grove Rd