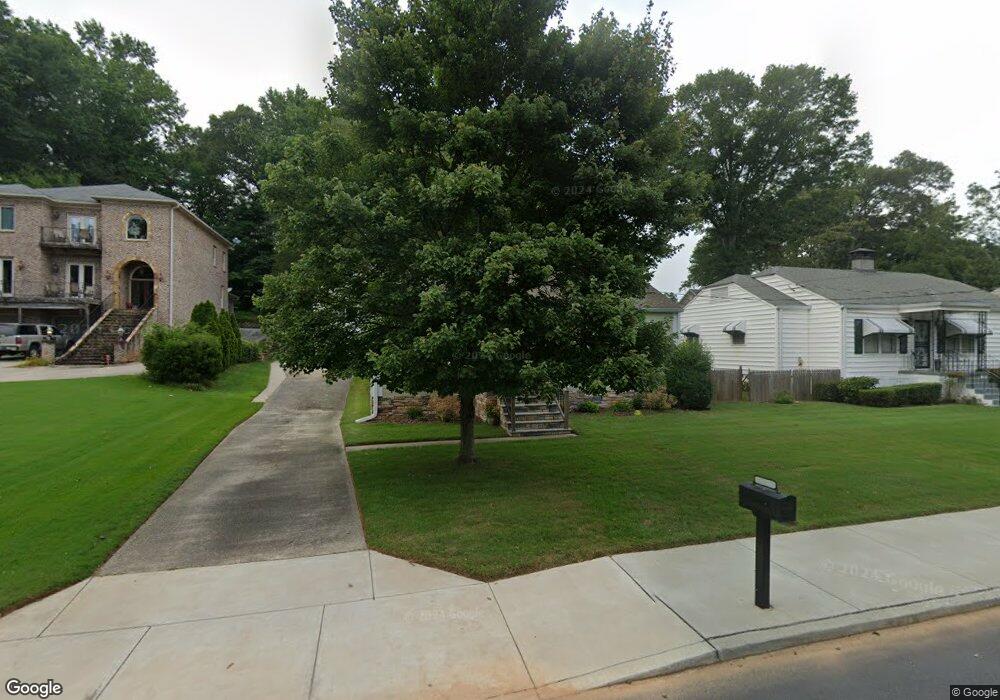
395 Alexander Cir SE Marietta, GA 30060
Frasier NeighborhoodEstimated Value: $389,000 - $452,000
3
Beds
2
Baths
1,291
Sq Ft
$320/Sq Ft
Est. Value
About This Home
This home is located at 395 Alexander Cir SE, Marietta, GA 30060 and is currently estimated at $413,268, approximately $320 per square foot. 395 Alexander Cir SE is a home located in Cobb County with nearby schools including Marietta Sixth Grade Academy, Park Street Elementary School, and Marietta Middle School.
Ownership History
Date
Name
Owned For
Owner Type
Purchase Details
Closed on
Feb 22, 2012
Sold by
Jamokee Investments Llc
Bought by
Brock Jeff
Current Estimated Value
Purchase Details
Closed on
Apr 8, 2009
Sold by
Last Stop Investments Llc
Bought by
Jamokee Investments Llc
Purchase Details
Closed on
Apr 7, 2009
Sold by
Smith Les
Bought by
Jp Morgan Chase Bk
Purchase Details
Closed on
Jul 31, 2002
Sold by
Dominguez Alfonso and Dominguez Maribel
Bought by
Smith Les
Home Financials for this Owner
Home Financials are based on the most recent Mortgage that was taken out on this home.
Original Mortgage
$21,950
Interest Rate
6.52%
Mortgage Type
New Conventional
Purchase Details
Closed on
Mar 17, 1997
Sold by
Brown Tammy
Bought by
Dominguez Alfonso Maribel
Create a Home Valuation Report for This Property
The Home Valuation Report is an in-depth analysis detailing your home's value as well as a comparison with similar homes in the area
Home Values in the Area
Average Home Value in this Area
Purchase History
| Date | Buyer | Sale Price | Title Company |
|---|---|---|---|
| Brock Jeff | $90,000 | -- | |
| Jamokee Investments Llc | -- | -- | |
| Jp Morgan Chase Bk | $43,000 | -- | |
| Smith Les | $109,900 | -- | |
| Dominguez Alfonso Maribel | $74,900 | -- |
Source: Public Records
Mortgage History
| Date | Status | Borrower | Loan Amount |
|---|---|---|---|
| Previous Owner | Smith Les | $21,950 | |
| Previous Owner | Smith Les | $87,900 | |
| Closed | Dominguez Alfonso Maribel | $0 |
Source: Public Records
Tax History Compared to Growth
Tax History
| Year | Tax Paid | Tax Assessment Tax Assessment Total Assessment is a certain percentage of the fair market value that is determined by local assessors to be the total taxable value of land and additions on the property. | Land | Improvement |
|---|---|---|---|---|
| 2025 | $183 | $148,748 | $60,000 | $88,748 |
| 2024 | $183 | $163,340 | $58,000 | $105,340 |
| 2023 | $30 | $170,912 | $70,000 | $100,912 |
| 2022 | $183 | $130,028 | $42,000 | $88,028 |
| 2021 | $194 | $87,752 | $42,000 | $45,752 |
| 2020 | $193 | $78,536 | $38,000 | $40,536 |
| 2019 | $192 | $68,900 | $30,000 | $38,900 |
| 2018 | $191 | $60,328 | $30,000 | $30,328 |
| 2017 | $152 | $48,184 | $18,000 | $30,184 |
| 2016 | $155 | $48,184 | $18,000 | $30,184 |
| 2015 | $237 | $31,592 | $8,000 | $23,592 |
| 2014 | $245 | $31,592 | $0 | $0 |
Source: Public Records
Map
Nearby Homes
- 355 Niles Ct Unit 2
- 180 Summit Ave SE
- 408 Silverbell Way
- 301 Niles Ct Unit 5
- 209 Waterman St SE
- 319 Atlanta St SE Unit 406
- 180 Easy Pines Way
- 486 Waterman St SE
- 490 Waterman St SE
- 494 Waterman St SE
- 104 Jackson Cir SE
- 307 Green St SE
- 0 Inglenook Walk
- 250 Green St SE
- 528 Mansell St SE
- 351 Washington Ave NE Unit 309
- 351 Washington Ave NE Unit 208
- 389 Washington Ave NE
- 397 Alexander Cir SE
- 391 Alexander Cir SE
- 401 Alexander Cir SE
- 394 Alexander Cir SE
- 387 Alexander Cir SE
- 0 SE Alexander Cir Unit 7012526
- 0 SE Alexander Cir Unit 8147046
- 0 SE Alexander Cir Unit 8589872
- 390 Alexander Cir SE
- 400 Alexander Cir SE
- 403 Alexander Cir SE
- 317 Phillips Dr SE
- 386 Alexander Cir SE
- 407 Alexander Cir SE
- 379 Alexander Cir SE
- 312 Phillips Dr SE
- 404 Alexander Cir SE
- 327 Phillips Dr SE
- 316 Phillips Dr SE
- 0 Phillips Dr SE Unit 7348092