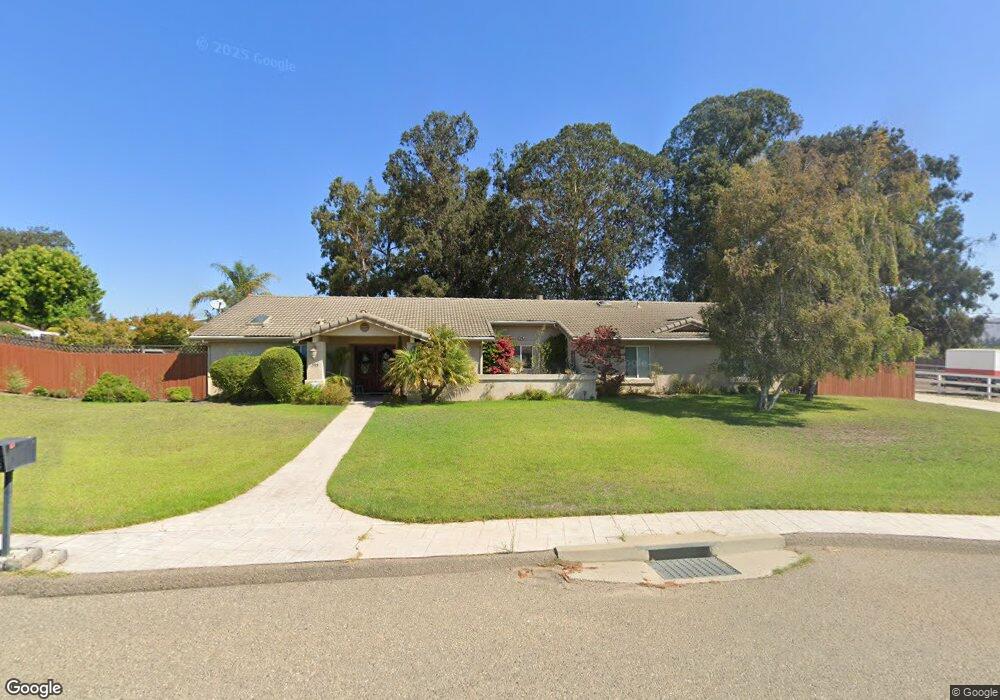
395 Apricot St Nipomo, CA 93444
Estimated Value: $1,026,498 - $1,111,000
3
Beds
3
Baths
2,175
Sq Ft
$498/Sq Ft
Est. Value
About This Home
This home is located at 395 Apricot St, Nipomo, CA 93444 and is currently estimated at $1,082,375, approximately $497 per square foot. 395 Apricot St is a home located in San Luis Obispo County with nearby schools including Dana Elementary School, Mesa Middle School, and Nipomo High School.
Ownership History
Date
Name
Owned For
Owner Type
Purchase Details
Closed on
Jan 31, 2013
Sold by
Broberg Timothy J and Broger Laura L
Bought by
Broberg Timothy J and Broger Laura L
Current Estimated Value
Purchase Details
Closed on
Aug 4, 2009
Sold by
Helbert Diane M
Bought by
Broberg Timothy J and Broberg Laura L
Purchase Details
Closed on
Jun 5, 2009
Sold by
Perolio Andrew C and Perolio Mary E
Bought by
Helbert Diane M
Purchase Details
Closed on
Feb 3, 2000
Sold by
Mesa Royale Inc
Bought by
Perolio Ii Andrew C and Perolio Mary E
Home Financials for this Owner
Home Financials are based on the most recent Mortgage that was taken out on this home.
Original Mortgage
$228,000
Interest Rate
8.06%
Create a Home Valuation Report for This Property
The Home Valuation Report is an in-depth analysis detailing your home's value as well as a comparison with similar homes in the area
Home Values in the Area
Average Home Value in this Area
Purchase History
| Date | Buyer | Sale Price | Title Company |
|---|---|---|---|
| Broberg Timothy J | -- | None Available | |
| Broberg Timothy J | -- | First American Title Company | |
| Helbert Diane M | $385,400 | None Available | |
| Perolio Ii Andrew C | $285,000 | Cuesta Title Company |
Source: Public Records
Mortgage History
| Date | Status | Borrower | Loan Amount |
|---|---|---|---|
| Previous Owner | Perolio Ii Andrew C | $228,000 | |
| Closed | Perolio Ii Andrew C | $28,500 |
Source: Public Records
Tax History Compared to Growth
Tax History
| Year | Tax Paid | Tax Assessment Tax Assessment Total Assessment is a certain percentage of the fair market value that is determined by local assessors to be the total taxable value of land and additions on the property. | Land | Improvement |
|---|---|---|---|---|
| 2025 | $6,831 | $671,213 | $283,972 | $387,241 |
| 2024 | $6,751 | $658,053 | $278,404 | $379,649 |
| 2023 | $6,751 | $645,151 | $272,946 | $372,205 |
| 2022 | $6,648 | $632,502 | $267,595 | $364,907 |
| 2021 | $6,966 | $620,101 | $262,349 | $357,752 |
| 2020 | $6,557 | $613,743 | $259,659 | $354,084 |
| 2019 | $6,516 | $601,710 | $254,568 | $347,142 |
| 2018 | $6,436 | $589,913 | $249,577 | $340,336 |
| 2017 | $6,314 | $578,347 | $244,684 | $333,663 |
| 2016 | $5,954 | $567,008 | $239,887 | $327,121 |
| 2015 | $5,867 | $558,492 | $236,284 | $322,208 |
| 2014 | $5,648 | $547,553 | $231,656 | $315,897 |
Source: Public Records
Map
Nearby Homes
- 457 Polaris Dr
- 945 Jeanette Ln
- 426 Polaris Dr
- 261 Hazel Ln
- 522 Higos Way
- 483 Violet Ave
- 1127 Starlite Dr
- 393 Uranus Ct
- 840 Story St
- 1180 Starlite Dr
- 232 Scarlett Cir
- 725 Monarch Ln
- 468 Neptune Dr
- Mesa Plan at Hill Street Terraces - Hill Street Series
- Pacific Plan at Hill Street Terraces - Hill Street Series
- Monarch Plan at Hill Street Terraces - Hill Street Series
- Rancho Plan at Hill Street Terraces - Hill Street Series
- Dana Plan at Hill Street Terraces - Hill Street Series
- 680 Hill St
- 719 W Tefft St
- 375 Apricot St
- 890 Simon Ln
- 390 Apricot St
- 880 Simon Ln
- 370 Apricot St
- 380 Apricot St
- 360 Apricot St Unit LOT
- 360 Apricot St
- 340 Apricot St
- 355 Apricot St
- 898 Harrier Ln
- 895 Harrier Ln
- 870 Simon Ln
- 415 Kayle Ct
- 431 Orchard Rd
- 330 Apricot St Unit LOT
- 330 Apricot St
- 955 Gold Crest Dr Unit 11
- 955 Gold Crest Dr
- 896 Harrier Ln