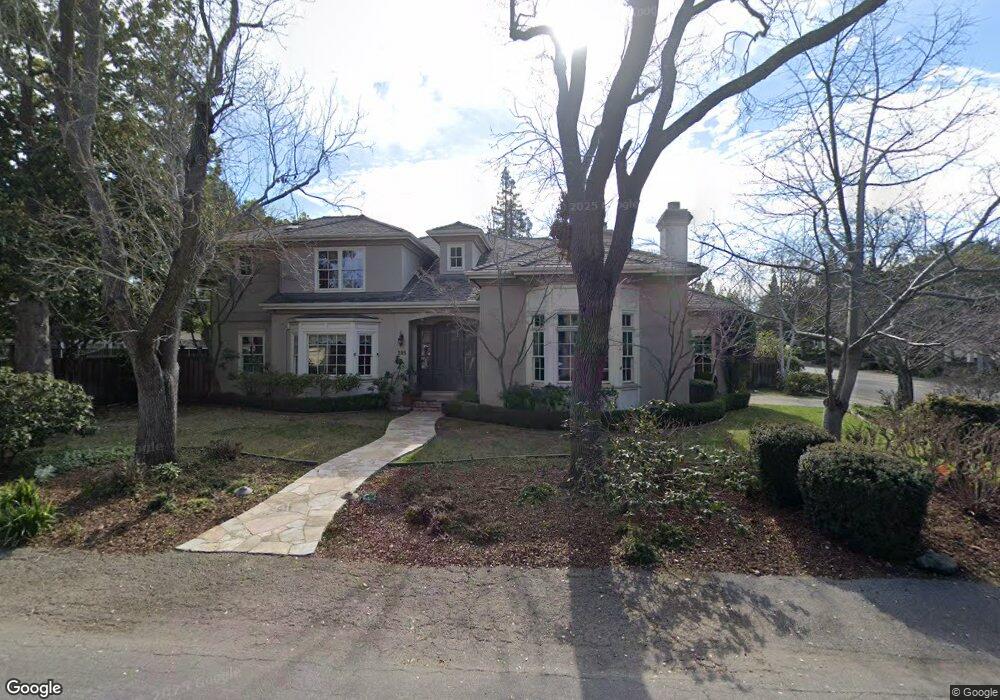
395 Brandon Way Menlo Park, CA 94025
Central Menlo Park NeighborhoodEstimated Value: $5,326,239 - $7,009,000
4
Beds
4
Baths
3,260
Sq Ft
$1,874/Sq Ft
Est. Value
About This Home
This home is located at 395 Brandon Way, Menlo Park, CA 94025 and is currently estimated at $6,110,060, approximately $1,874 per square foot. 395 Brandon Way is a home located in San Mateo County with nearby schools including Oak Knoll Elementary School, Hillview Middle School, and Menlo-Atherton High School.
Ownership History
Date
Name
Owned For
Owner Type
Purchase Details
Closed on
Jun 22, 2016
Sold by
Fantuzzi Victoria J
Bought by
Fantuzzi Victoria J and Vjt Trust
Current Estimated Value
Purchase Details
Closed on
Aug 6, 2008
Sold by
Fantuzzi Victoria J
Bought by
Fantuzzi Victoria J and Fantuzzi Joseph D
Purchase Details
Closed on
Jun 16, 2008
Sold by
Fantuzzi Joseph D
Bought by
Fantuzzi Victoria J
Purchase Details
Closed on
Sep 25, 2000
Sold by
Fantuzzi Joseph D and Fantuzzi Victoria J
Bought by
Fantuzzi Joseph D and Fantuzzi Victoria
Purchase Details
Closed on
Aug 22, 1997
Sold by
Schwerdfeger Stephen P and Schwerdfeger Susan M
Bought by
Fantuzzi Joseph D and Fantuzzi Victoria J
Home Financials for this Owner
Home Financials are based on the most recent Mortgage that was taken out on this home.
Original Mortgage
$575,600
Outstanding Balance
$60,408
Interest Rate
3.95%
Estimated Equity
$6,049,652
Purchase Details
Closed on
Oct 15, 1996
Sold by
Schwerdfeger Stephen P and Schwerdfeger Susan M
Bought by
Schwerdfeger Stephen P and Schwerdfeger Susan M
Purchase Details
Closed on
Mar 14, 1996
Sold by
Scott Donald P
Bought by
Schwerdfeger Stephen and Schwerdfeger Susan M
Create a Home Valuation Report for This Property
The Home Valuation Report is an in-depth analysis detailing your home's value as well as a comparison with similar homes in the area
Home Values in the Area
Average Home Value in this Area
Purchase History
| Date | Buyer | Sale Price | Title Company |
|---|---|---|---|
| Fantuzzi Victoria J | -- | None Available | |
| Fantuzzi Victoria J | -- | None Available | |
| Fantuzzi Victoria J | -- | None Available | |
| Fantuzzi Joseph D | -- | None Available | |
| Fantuzzi Joseph D | -- | -- | |
| Fantuzzi Joseph D | $719,500 | North American Title Insuran | |
| Schwerdfeger Stephen P | -- | -- | |
| Schwerdfeger Stephen | $633,000 | North American Title Co |
Source: Public Records
Mortgage History
| Date | Status | Borrower | Loan Amount |
|---|---|---|---|
| Open | Fantuzzi Joseph D | $575,600 |
Source: Public Records
Tax History Compared to Growth
Tax History
| Year | Tax Paid | Tax Assessment Tax Assessment Total Assessment is a certain percentage of the fair market value that is determined by local assessors to be the total taxable value of land and additions on the property. | Land | Improvement |
|---|---|---|---|---|
| 2025 | $18,133 | $1,418,252 | $574,423 | $843,829 |
| 2023 | $18,133 | $1,363,181 | $552,118 | $811,063 |
| 2022 | $17,271 | $1,336,453 | $541,293 | $795,160 |
| 2021 | $16,813 | $1,310,249 | $530,680 | $779,569 |
| 2020 | $16,688 | $1,296,815 | $525,239 | $771,576 |
| 2019 | $16,461 | $1,271,389 | $514,941 | $756,448 |
| 2018 | $16,093 | $1,246,461 | $504,845 | $741,616 |
| 2017 | $15,820 | $1,222,022 | $494,947 | $727,075 |
| 2016 | $15,321 | $1,198,062 | $485,243 | $712,819 |
| 2015 | $15,148 | $1,180,067 | $477,955 | $702,112 |
| 2014 | $14,861 | $1,156,952 | $468,593 | $688,359 |
Source: Public Records
Map
Nearby Homes
- 1715 Bay Laurel Dr
- 460 Olive St
- 705 Evergreen St
- 1001 Olive St
- 2030 Sand Hill Rd
- 455 San Mateo Dr
- 1840 Santa Cruz Ave
- 1100 Hobart St
- 8 Nancy Way
- 2165 Santa Cruz Ave
- 1224 Whitaker Way
- 980 Lucky Ave
- 2140 Santa Cruz Ave Unit B104
- 2160 Santa Cruz Ave Unit 22
- 1140 Cotton St
- 1278 Santa Cruz Ave
- 2171 Clayton Dr
- 2146 Sand Hill Rd
- 2435 Sharon Oaks Dr
- 2051 Gordon Ave
- 385 Brandon Way
- 1745 Oak Ave
- 1740 Bay Laurel Dr
- 1701 Oak Ave
- 1720 Oak Ave
- 1730 Bay Laurel Dr
- 1700 Oak Ave
- 380 Brandon Way
- 1755 Oak Ave
- 1750 Bay Laurel Dr
- 1740 Oak Ave
- 370 Brandon Way
- 1690 Oak Ave
- 375 August Cir
- 5 Randall Place
- 2 Randall Place
- 1745 Bay Laurel Dr
- 365 August Cir
- 1760 Bay Laurel Dr
- 3 Randall Place