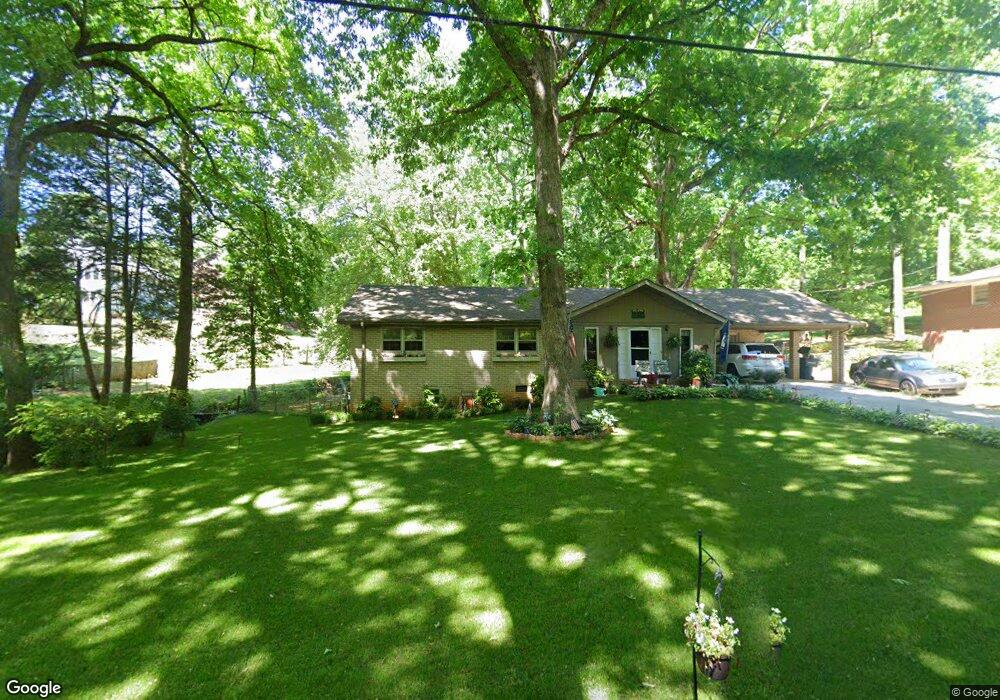
395 Chambers Ave Cornelia, GA 30531
Estimated Value: $276,711 - $319,000
3
Beds
2
Baths
1,627
Sq Ft
$178/Sq Ft
Est. Value
About This Home
This home is located at 395 Chambers Ave, Cornelia, GA 30531 and is currently estimated at $289,178, approximately $177 per square foot. 395 Chambers Ave is a home located in Habersham County with nearby schools including Cornelia Elementary School, Wilbanks Middle School, and Habersham Success Academy.
Ownership History
Date
Name
Owned For
Owner Type
Purchase Details
Closed on
Mar 28, 2025
Sold by
Brown Diane B
Bought by
Reed Denise M and Reed Mark C
Current Estimated Value
Home Financials for this Owner
Home Financials are based on the most recent Mortgage that was taken out on this home.
Original Mortgage
$238,000
Outstanding Balance
$221,085
Interest Rate
6.76%
Mortgage Type
New Conventional
Estimated Equity
$68,093
Create a Home Valuation Report for This Property
The Home Valuation Report is an in-depth analysis detailing your home's value as well as a comparison with similar homes in the area
Home Values in the Area
Average Home Value in this Area
Purchase History
| Date | Buyer | Sale Price | Title Company |
|---|---|---|---|
| Reed Denise M | $280,000 | -- |
Source: Public Records
Mortgage History
| Date | Status | Borrower | Loan Amount |
|---|---|---|---|
| Open | Reed Denise M | $238,000 |
Source: Public Records
Tax History
| Year | Tax Paid | Tax Assessment Tax Assessment Total Assessment is a certain percentage of the fair market value that is determined by local assessors to be the total taxable value of land and additions on the property. | Land | Improvement |
|---|---|---|---|---|
| 2025 | $2,594 | $99,551 | $16,192 | $83,359 |
| 2024 | $1,785 | $68,788 | $10,224 | $58,564 |
| 2023 | $1,471 | $58,852 | $10,224 | $48,628 |
| 2022 | $1,359 | $52,108 | $10,224 | $41,884 |
| 2021 | $1,238 | $47,692 | $10,224 | $37,468 |
| 2020 | $1,145 | $42,556 | $10,224 | $32,332 |
| 2019 | $1,146 | $42,556 | $10,224 | $32,332 |
| 2018 | $1,000 | $37,444 | $5,112 | $32,332 |
| 2017 | $936 | $34,836 | $5,112 | $29,724 |
| 2016 | $908 | $87,090 | $5,112 | $29,724 |
| 2015 | $898 | $87,090 | $5,112 | $29,724 |
| 2014 | $900 | $85,670 | $5,112 | $29,156 |
| 2013 | -- | $34,268 | $5,112 | $29,156 |
Source: Public Records
Map
Nearby Homes
- 169 Short Ave
- 192 Summit St
- 169 Esta St
- 391 Yonah St
- 125 Maple St
- 605 Chenocetah Dr
- 109 Grove Park Dr
- 199 Sunrise Cir
- 170 Sequoyah Dr
- 0 Chase Rd Unit 10658099
- 0 Irvin St
- 294 Hillcrest Heights
- 114 Sugar Creek Dr
- 142 Galloway St
- 112 Galloway St
- 795 Wayside St
- 240 Sugar Maple Dr
- 167 South St
- 1046 Chase Rd
- 0 Highway 105 Unit 10421143
- 351 Chambers Ave
- 262 Dolson St
- 282 Dolson St
- 147 Short Ave
- 120 Short Ave
- 357 Forest St
- 265 Dolson St
- 297 Dolson St
- 388 Hillcrest St
- 317 Chambers Ave
- 218 Huff Ave
- 216 Dogwood Ave
- 318 Dolson St
- 342 Forest St
- 206 Skyland Dr
- 210 Dogwood Ave Unit A
- 330 Summit St
- 130 Skyland Dr
- 0 Holly Dr Unit Tract 2 9009396
- Tract 2 Holly Dr
Your Personal Tour Guide
Ask me questions while you tour the home.