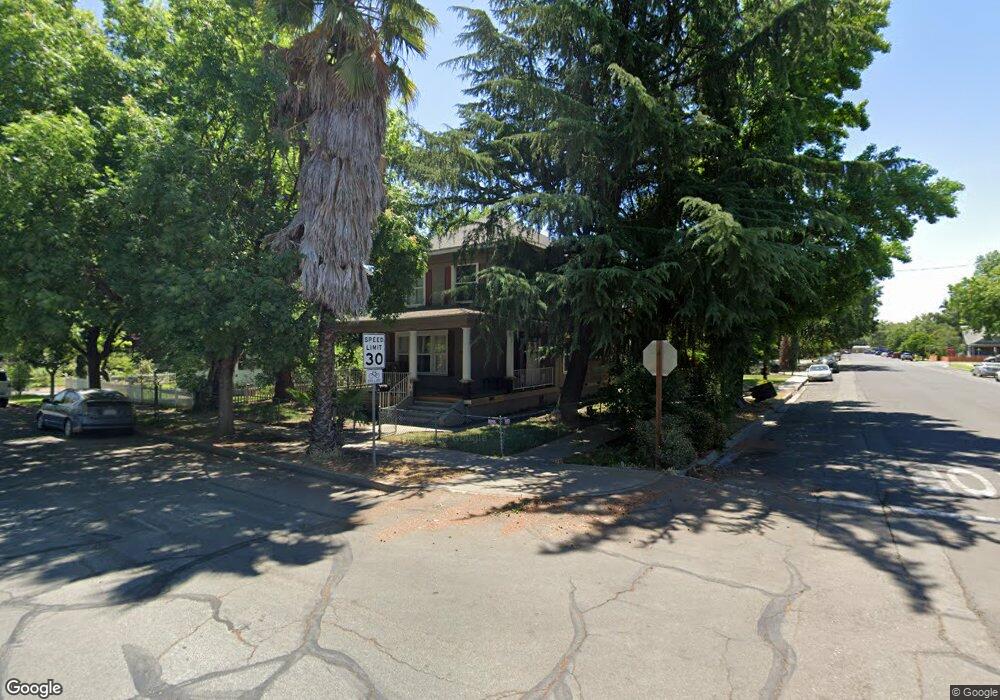
395 Hazel St Unit 1 Gridley, CA 95948
Estimated Value: $375,000 - $409,000
4
Beds
2
Baths
2,072
Sq Ft
$186/Sq Ft
Est. Value
About This Home
This home is located at 395 Hazel St Unit 1, Gridley, CA 95948 and is currently estimated at $385,604, approximately $186 per square foot. 395 Hazel St Unit 1 is a home located in Butte County with nearby schools including Wilson Elementary School, McKinley Elementary School, and Sycamore Middle School.
Ownership History
Date
Name
Owned For
Owner Type
Purchase Details
Closed on
May 5, 2021
Sold by
Woolery Ryan O
Bought by
Woolery Mistie J
Current Estimated Value
Home Financials for this Owner
Home Financials are based on the most recent Mortgage that was taken out on this home.
Original Mortgage
$296,969
Outstanding Balance
$269,128
Interest Rate
3.1%
Mortgage Type
New Conventional
Estimated Equity
$116,476
Purchase Details
Closed on
Aug 28, 2020
Sold by
Dela Torre Lupe Cruz
Bought by
Dela Torre Lupe and Lalupe De La
Home Financials for this Owner
Home Financials are based on the most recent Mortgage that was taken out on this home.
Original Mortgage
$157,500
Interest Rate
2.9%
Mortgage Type
New Conventional
Purchase Details
Closed on
Aug 15, 2017
Sold by
Torres Lupe De La
Bought by
Torre Lupe De La and The Lupe De La Torre 2016 Revoa
Purchase Details
Closed on
Aug 30, 2002
Sold by
Hud
Bought by
Delatorre Lupe
Home Financials for this Owner
Home Financials are based on the most recent Mortgage that was taken out on this home.
Original Mortgage
$104,500
Interest Rate
6.43%
Purchase Details
Closed on
Apr 15, 2002
Sold by
Wells Fargo Home Mtg Inc
Bought by
Hud
Purchase Details
Closed on
Dec 27, 2001
Sold by
Cezario Vicki A
Bought by
Wells Fargo Home Mtg Inc and Norwest Mtg Inc
Purchase Details
Closed on
Aug 31, 1999
Sold by
Hud
Bought by
Cezario Vicki A
Home Financials for this Owner
Home Financials are based on the most recent Mortgage that was taken out on this home.
Original Mortgage
$111,623
Interest Rate
7.66%
Mortgage Type
FHA
Purchase Details
Closed on
Jan 21, 1999
Sold by
California Housing Finance Agency
Bought by
Hud
Purchase Details
Closed on
Jan 8, 1999
Sold by
Thao Sao
Bought by
California Housing Finance Agency
Create a Home Valuation Report for This Property
The Home Valuation Report is an in-depth analysis detailing your home's value as well as a comparison with similar homes in the area
Home Values in the Area
Average Home Value in this Area
Purchase History
| Date | Buyer | Sale Price | Title Company |
|---|---|---|---|
| Woolery Mistie J | -- | Mid Valley Title | |
| Woolery Mistie J | $300,000 | Mid Valley Title | |
| Dela Torre Lupe | -- | Placer Title Company | |
| Torre Lupe Cruz De La | -- | Placer Title | |
| Torre Lupe De La | -- | None Available | |
| Delatorre Lupe | $110,000 | Bidwell Title & Escrow | |
| Hud | -- | First American Title Ins Co | |
| Wells Fargo Home Mtg Inc | $123,114 | Mid Valley Title | |
| Cezario Vicki A | $90,500 | Bidwell Title & Escrow Co | |
| Hud | -- | Fidelity National Title Co | |
| California Housing Finance Agency | $83,271 | Fidelity National Title Ins |
Source: Public Records
Mortgage History
| Date | Status | Borrower | Loan Amount |
|---|---|---|---|
| Open | Woolery Mistie J | $296,969 | |
| Previous Owner | Torre Lupe Cruz De La | $157,500 | |
| Previous Owner | Delatorre Lupe | $104,500 | |
| Previous Owner | Cezario Vicki A | $111,623 |
Source: Public Records
Tax History Compared to Growth
Tax History
| Year | Tax Paid | Tax Assessment Tax Assessment Total Assessment is a certain percentage of the fair market value that is determined by local assessors to be the total taxable value of land and additions on the property. | Land | Improvement |
|---|---|---|---|---|
| 2025 | $3,537 | $324,728 | $97,418 | $227,310 |
| 2024 | $3,537 | $318,361 | $95,508 | $222,853 |
| 2023 | $3,518 | $312,120 | $93,636 | $218,484 |
| 2022 | $3,298 | $306,000 | $91,800 | $214,200 |
| 2021 | $1,559 | $147,165 | $40,132 | $107,033 |
| 2020 | $1,555 | $145,657 | $39,721 | $105,936 |
| 2019 | $1,543 | $142,802 | $38,943 | $103,859 |
| 2018 | $1,499 | $140,003 | $38,180 | $101,823 |
| 2017 | $1,470 | $137,259 | $37,432 | $99,827 |
| 2016 | $1,413 | $134,569 | $36,699 | $97,870 |
| 2015 | $1,459 | $132,548 | $36,148 | $96,400 |
| 2014 | $1,434 | $129,952 | $35,440 | $94,512 |
Source: Public Records
Map
Nearby Homes