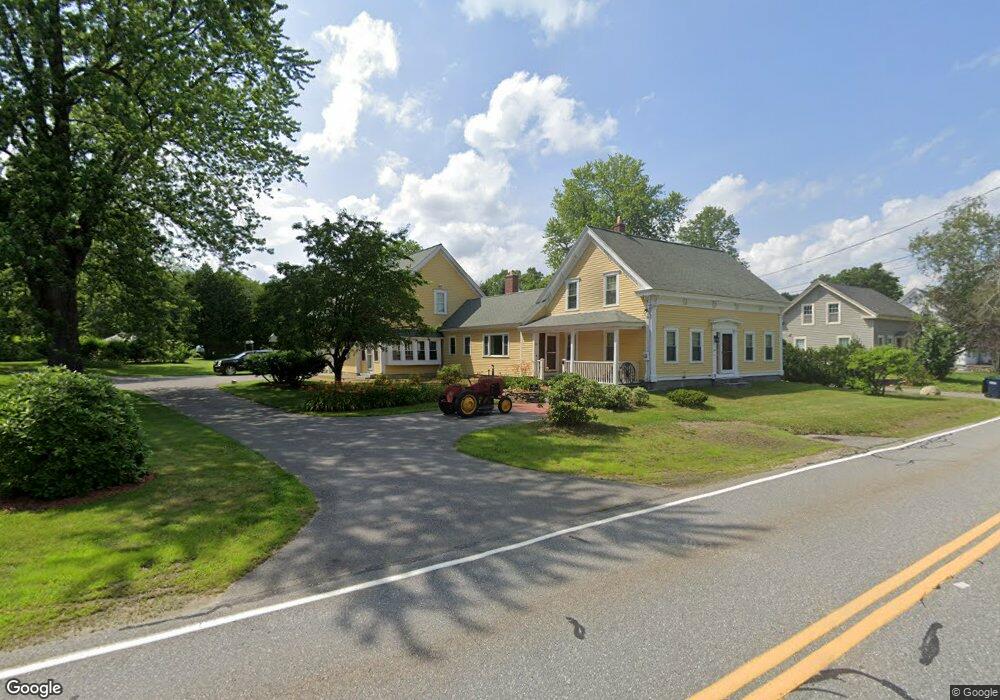
395 N Main St Salem, NH 03079
Arlington Pond NeighborhoodEstimated Value: $694,253 - $928,000
4
Beds
4
Baths
2,968
Sq Ft
$266/Sq Ft
Est. Value
About This Home
This home is located at 395 N Main St, Salem, NH 03079 and is currently estimated at $788,813, approximately $265 per square foot. 395 N Main St is a home located in Rockingham County with nearby schools including North Salem Elementary School, Woodbury School, and Salem High School.
Ownership History
Date
Name
Owned For
Owner Type
Purchase Details
Closed on
Apr 11, 2025
Sold by
Dibartolomeo Michael J and Dibartolomeo Jennie N
Bought by
Di Bartolomeo
Current Estimated Value
Purchase Details
Closed on
Dec 1, 2016
Sold by
Dibartolomeo Michael J and Dibartolomeo Jennie N
Bought by
Pontbriand Andrew and Peterson Angela
Purchase Details
Closed on
Oct 3, 2008
Sold by
N Salem United Meth Ch
Bought by
Dibartolomeo Michael J and Dibartolomeo Jennie
Purchase Details
Closed on
Oct 15, 2001
Sold by
Sanborn Keith O
Bought by
North Salem United Met
Create a Home Valuation Report for This Property
The Home Valuation Report is an in-depth analysis detailing your home's value as well as a comparison with similar homes in the area
Home Values in the Area
Average Home Value in this Area
Purchase History
| Date | Buyer | Sale Price | Title Company |
|---|---|---|---|
| Di Bartolomeo | -- | None Available | |
| Di Bartolomeo | -- | None Available | |
| Pontbriand Andrew | $307,000 | -- | |
| Pontbriand Andrew | $307,000 | -- | |
| Dibartolomeo Michael J | $259,000 | -- | |
| Dibartolomeo Michael J | $259,000 | -- | |
| North Salem United Met | $260,000 | -- | |
| North Salem United Met | $260,000 | -- |
Source: Public Records
Mortgage History
| Date | Status | Borrower | Loan Amount |
|---|---|---|---|
| Previous Owner | North Salem United Met | $240,000 | |
| Previous Owner | North Salem United Met | $302,250 | |
| Previous Owner | North Salem United Met | $308,000 |
Source: Public Records
Tax History Compared to Growth
Tax History
| Year | Tax Paid | Tax Assessment Tax Assessment Total Assessment is a certain percentage of the fair market value that is determined by local assessors to be the total taxable value of land and additions on the property. | Land | Improvement |
|---|---|---|---|---|
| 2024 | $8,298 | $471,500 | $172,100 | $299,400 |
| 2023 | $7,997 | $471,500 | $172,100 | $299,400 |
| 2022 | $7,568 | $471,500 | $172,100 | $299,400 |
| 2021 | $7,535 | $471,500 | $172,100 | $299,400 |
| 2020 | $7,661 | $347,900 | $123,100 | $224,800 |
| 2019 | $7,647 | $347,900 | $123,100 | $224,800 |
| 2018 | $7,518 | $347,900 | $123,100 | $224,800 |
| 2017 | $7,250 | $347,900 | $123,100 | $224,800 |
| 2016 | $7,108 | $347,900 | $123,100 | $224,800 |
| 2015 | $7,157 | $334,600 | $117,500 | $217,100 |
| 2014 | $6,956 | $334,600 | $117,500 | $217,100 |
| 2013 | $6,846 | $334,600 | $117,500 | $217,100 |
Source: Public Records
Map
Nearby Homes
- 21 Teague Dr
- 34 Shore Dr
- 60 Shore Dr
- 10 Independence Dr
- 26 King St
- 69 Caddy Dr
- 27 Norwood Rd
- 84 Caddy Dr
- 16 Autumn Woods Rd
- 29 Hawk Dr
- 136 Shore Dr
- 182 Shore Dr
- 5 Betty Ln
- 3 Providence Hill Rd
- 114 Chases Grove Rd
- 67 & 69 Conleys Grove Rd
- 116 Chases Grove Rd
- 120 Chases Grove Rd
- 117C Chases Grove Rd
- 44 Trails Edge Rd