Estimated Value: $509,000 - $665,020
Studio
--
Bath
2,920
Sq Ft
$201/Sq Ft
Est. Value
About This Home
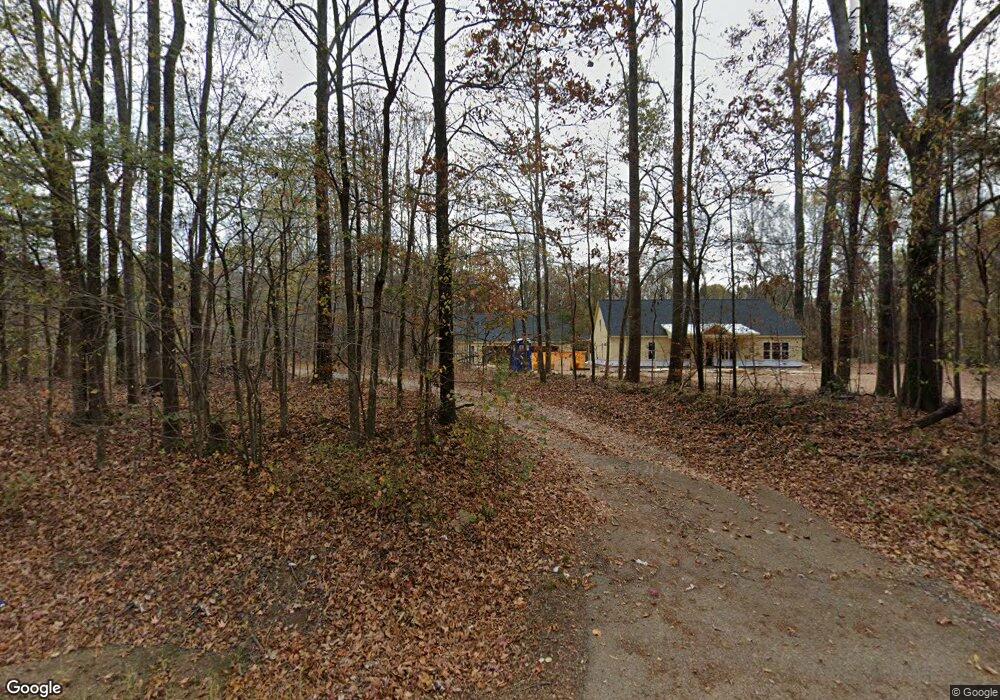
This home is located at 3950 Highway 70, Mason, TN 38049 and is currently estimated at $587,010, approximately $201 per square foot. 3950 Highway 70 is a home located in Fayette County with nearby schools including Oakland Elementary School, West Junior High School, and Fayette Ware Comprehensive High School.
Ownership History
Date
Name
Owned For
Owner Type
Purchase Details
Closed on
Mar 14, 2022
Sold by
Vickie Houston
Bought by
Cornelius Charles Michael and Cornelius Amy Rebecca
Current Estimated Value
Purchase Details
Closed on
Dec 18, 2020
Sold by
Biddinger Matthew L and Biddinger Carrie M
Bought by
Houston Vickie
Home Financials for this Owner
Home Financials are based on the most recent Mortgage that was taken out on this home.
Original Mortgage
$44,895
Interest Rate
2.7%
Mortgage Type
New Conventional
Purchase Details
Closed on
Sep 28, 2006
Sold by
Volner James Keith
Bought by
Biddinger Matthew L
Purchase Details
Closed on
Jan 7, 1999
Sold by
Volner James Keith
Bought by
Volner James Keith
Purchase Details
Closed on
Mar 23, 1988
Bought by
Volner James H and Betty Sue
Purchase Details
Closed on
Jan 1, 1984
Bought by
Johnson Gladys S
Purchase Details
Closed on
Oct 4, 1982
Create a Home Valuation Report for This Property
The Home Valuation Report is an in-depth analysis detailing your home's value as well as a comparison with similar homes in the area
Purchase History
We collect this data history from publicly available records. To have your information removed, we recommend requesting removal directly through your county’s website.
| Date | Buyer | Sale Price | Title Company |
|---|---|---|---|
| Cornelius Charles Michael | $185,000 | None Listed On Document | |
| Houston Vickie | $43,500 | None Listed On Document | |
| Biddinger Matthew L | $39,900 | -- | |
| Volner James Keith | $24,000 | -- | |
| Volner James H | $12,700 | -- | |
| Johnson Gladys S | -- | -- | |
| -- | -- | -- |
Source: Public Records
Mortgage History
We collect this data history from publicly available records. To have your information removed, we recommend requesting removal directly through your county’s website.
| Date | Status | Borrower | Loan Amount |
|---|---|---|---|
| Previous Owner | Houston Vickie | $44,895 |
Source: Public Records
Tax History
| Year | Tax Paid | Tax Assessment Tax Assessment Total Assessment is a certain percentage of the fair market value that is determined by local assessors to be the total taxable value of land and additions on the property. | Land | Improvement |
|---|---|---|---|---|
| 2025 | $1,257 | $171,450 | $15,500 | $155,950 |
| 2024 | $1,257 | $97,300 | $10,750 | $86,550 |
| 2023 | $297 | $97,300 | $0 | $0 |
| 2022 | $652 | $50,475 | $10,750 | $39,725 |
| 2021 | $310 | $50,475 | $10,750 | $39,725 |
| 2020 | $162 | $10,750 | $10,750 | $0 |
| 2019 | $162 | $10,750 | $10,750 | $0 |
| 2018 | $162 | $10,750 | $10,750 | $0 |
| 2017 | $162 | $10,750 | $10,750 | $0 |
| 2016 | $173 | $10,750 | $10,750 | $0 |
| 2015 | $173 | $10,750 | $10,750 | $0 |
| 2014 | $173 | $10,750 | $10,750 | $0 |
Source: Public Records
Map
Nearby Homes
- 1215 Beaver Creek Rd
- 1215 Beaver Creek Dr
- 5355 Highway 70
- 897 Burrowtown Rd
- 800 Tennessee 59
- 0 Willow Oak Dr
- 0 Willow Oak Dr Unit 10217366
- 830 Mcknight Loop
- 900 Centerpoint Dr
- 310 Walnut Bend Rd
- 145 Walnut Bend Rd
- 0 Hwy 196 Main St Hwy Unit 10176122
- 0 Hwy 196-10acres Main St Hwy Unit 10176123
- 0 Boyland Way
- 0 Andrew Rd
- 40 Aztec Dr
- 25 Foxchase Dr
- 446 Canaan Grove Rd S
- 4374 Gainsville Rd
- 213 W Harmony Dr
- 3950 Hwy 70
- 3880 Highway 70
- 4070 Highway 70
- 3882 Highway 70
- 4050 Highway 70
- 4025 Highway 70
- 4075 Highway 70
- 4110 Highway 70
- 25 Poplar Springs Loop
- 4140 Highway 70
- 105 Poplar Springs Loop
- 4165 Highway 70
- 245 Poplar Springs Loop
- 80 Poplar Springs Loop
- 355 Poplar Springs Loop
- 310 Poplar Springs Loop
- 455 Poplar Springs Loop
- 4310 Highway 70
- 4310 Highway 70
- 4310 Highway 70
Your Personal Tour Guide
Ask me questions while you tour the home.