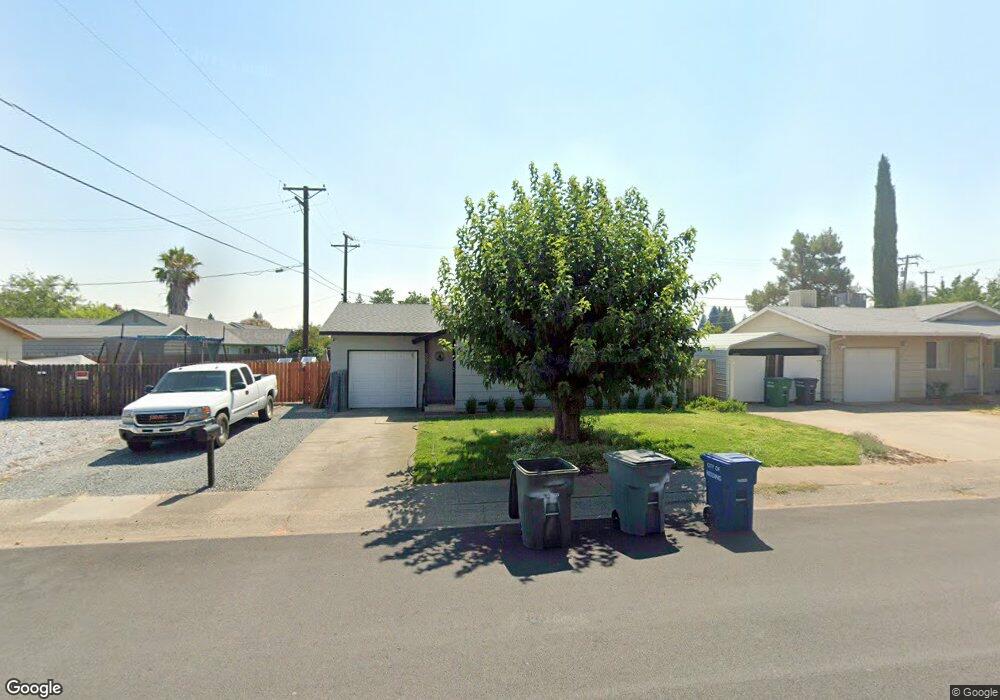
3959 Polaris Way Unit SFR Redding, CA 96002
Starview NeighborhoodEstimated Value: $264,000 - $288,000
3
Beds
1
Bath
930
Sq Ft
$295/Sq Ft
Est. Value
About This Home
This home is located at 3959 Polaris Way Unit SFR, Redding, CA 96002 and is currently estimated at $274,073, approximately $294 per square foot. 3959 Polaris Way Unit SFR is a home located in Shasta County with nearby schools including Alta Mesa Elementary School, Parsons Junior High School, and Enterprise High School.
Ownership History
Date
Name
Owned For
Owner Type
Purchase Details
Closed on
Mar 16, 2021
Sold by
Nihart Gary and Nihart Kathleen
Bought by
Mahrt Cody
Current Estimated Value
Home Financials for this Owner
Home Financials are based on the most recent Mortgage that was taken out on this home.
Original Mortgage
$219,450
Outstanding Balance
$196,721
Interest Rate
2.7%
Mortgage Type
New Conventional
Estimated Equity
$77,352
Purchase Details
Closed on
Aug 4, 2015
Sold by
Nihart Gary W and Nihart Kathy A
Bought by
Nihart 2015 Trust
Purchase Details
Closed on
May 8, 2000
Sold by
Tirpik Peter J and Tirpik Jeanne V
Bought by
Nihart Gary W and Nihart Kathy A
Home Financials for this Owner
Home Financials are based on the most recent Mortgage that was taken out on this home.
Original Mortgage
$59,350
Interest Rate
8.22%
Mortgage Type
Purchase Money Mortgage
Create a Home Valuation Report for This Property
The Home Valuation Report is an in-depth analysis detailing your home's value as well as a comparison with similar homes in the area
Home Values in the Area
Average Home Value in this Area
Purchase History
| Date | Buyer | Sale Price | Title Company |
|---|---|---|---|
| Mahrt Cody | $231,000 | Fidelity Natl Ttl Co Of Ca | |
| Nihart 2015 Trust | -- | None Available | |
| Nihart Gary W | $66,000 | Fidelity National Title Co |
Source: Public Records
Mortgage History
| Date | Status | Borrower | Loan Amount |
|---|---|---|---|
| Open | Mahrt Cody | $219,450 | |
| Previous Owner | Nihart Gary W | $59,350 |
Source: Public Records
Tax History Compared to Growth
Tax History
| Year | Tax Paid | Tax Assessment Tax Assessment Total Assessment is a certain percentage of the fair market value that is determined by local assessors to be the total taxable value of land and additions on the property. | Land | Improvement |
|---|---|---|---|---|
| 2025 | $2,647 | $250,040 | $48,709 | $201,331 |
| 2024 | $2,608 | $245,138 | $47,754 | $197,384 |
| 2023 | $2,608 | $240,332 | $46,818 | $193,514 |
| 2022 | $2,533 | $235,620 | $45,900 | $189,720 |
| 2021 | $1,044 | $93,696 | $28,389 | $65,307 |
| 2020 | $1,039 | $92,736 | $28,098 | $64,638 |
| 2019 | $1,031 | $90,919 | $27,548 | $63,371 |
| 2018 | $1,019 | $89,137 | $27,008 | $62,129 |
| 2017 | $1,036 | $87,390 | $26,479 | $60,911 |
| 2016 | $970 | $85,677 | $25,960 | $59,717 |
| 2015 | $962 | $84,391 | $25,571 | $58,820 |
| 2014 | $955 | $82,739 | $25,071 | $57,668 |
Source: Public Records
Map
Nearby Homes
- 2408 Castlewood Dr
- 3849 Capricorn Way
- 4151 Saratoga Dr
- 2269 Corona St
- 3688 Polaris Way
- 3512 Capricorn Way
- 2145 Venus Way
- 3792 Thomason Trail
- 2796 Madison River Dr
- 3387 Bridger Dr
- 2068 Solar Way
- 2366 Templeton Dr
- 3361 Alta Mesa Dr
- 3897 Sunwood Dr
- 0 Shasta View Unit 25-1945
- 3685 Wimbledon Dr
- 2364 La Madre Ct
- 1959 Alexis Ct
- 3195 Forest Hills Dr
- 2877 Green Riffle Rd
- 3959 Polaris Way
- 3967 Polaris Way
- 3945 Polaris Way
- 2523 Corona St
- 3979 Polaris Way
- 2537 Corona St
- 2494 Nebula St
- 2495 Corona St
- 3999 Polaris Way
- 2551 Corona St
- 2472 Nebula St
- 2477 Corona St
- 2477 Nebula St
- 2516 Corona St
- 3925 Polaris Way
- 2461 Nebula St
- 2530 Corona St
- 2460 Nebula St
- 2565 Corona St
- 2494 Corona St