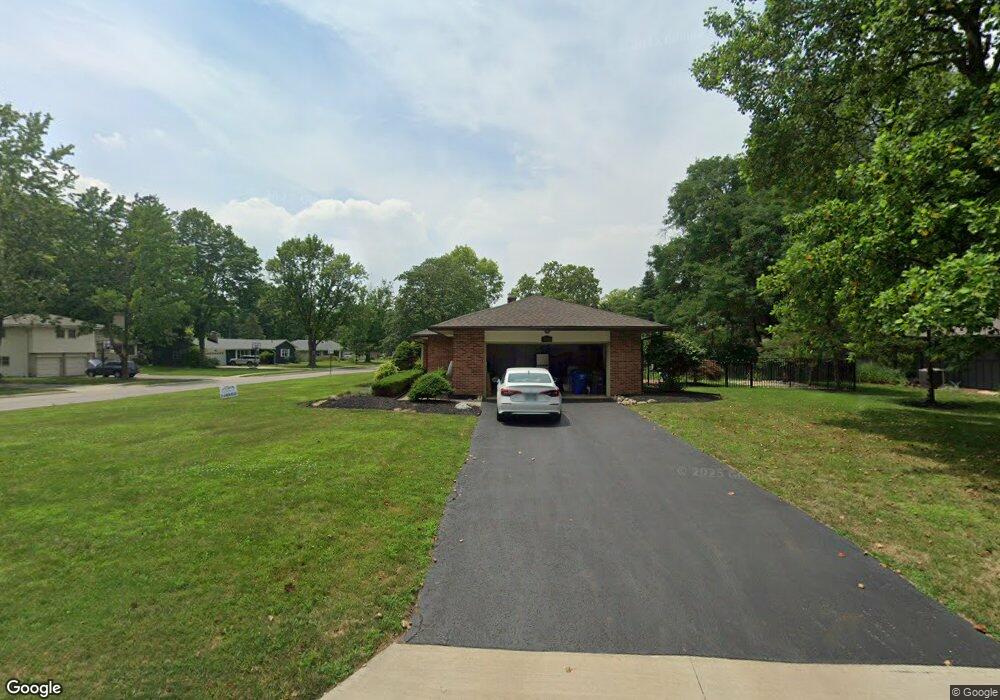
3959 Woodbridge Rd Columbus, OH 43220
Estimated Value: $469,000 - $675,000
2
Beds
4
Baths
1,908
Sq Ft
$314/Sq Ft
Est. Value
About This Home
This home is located at 3959 Woodbridge Rd, Columbus, OH 43220 and is currently estimated at $599,073, approximately $313 per square foot. 3959 Woodbridge Rd is a home located in Franklin County with nearby schools including Windermere Elementary School, Hastings Middle School, and Upper Arlington High School.
Ownership History
Date
Name
Owned For
Owner Type
Purchase Details
Closed on
Jun 9, 2020
Sold by
Massucci Leeann M
Bought by
Massucci Leeann M and Massucci Sherry M
Current Estimated Value
Home Financials for this Owner
Home Financials are based on the most recent Mortgage that was taken out on this home.
Original Mortgage
$260,000
Interest Rate
3.2%
Mortgage Type
Future Advance Clause Open End Mortgage
Purchase Details
Closed on
Apr 14, 2020
Sold by
Quaranto Mary L
Bought by
Massucci Leeann M
Home Financials for this Owner
Home Financials are based on the most recent Mortgage that was taken out on this home.
Original Mortgage
$260,000
Interest Rate
3.2%
Mortgage Type
Future Advance Clause Open End Mortgage
Purchase Details
Closed on
Aug 10, 1998
Sold by
Cox John M
Bought by
Quaranto Bruno A and Quaranto Mary L
Create a Home Valuation Report for This Property
The Home Valuation Report is an in-depth analysis detailing your home's value as well as a comparison with similar homes in the area
Home Values in the Area
Average Home Value in this Area
Purchase History
| Date | Buyer | Sale Price | Title Company |
|---|---|---|---|
| Massucci Leeann M | $162,500 | None Available | |
| Massucci Leeann M | $325,000 | None Available | |
| Quaranto Bruno A | $169,000 | Franklin Abstract |
Source: Public Records
Mortgage History
| Date | Status | Borrower | Loan Amount |
|---|---|---|---|
| Previous Owner | Massucci Leeann M | $260,000 |
Source: Public Records
Tax History Compared to Growth
Tax History
| Year | Tax Paid | Tax Assessment Tax Assessment Total Assessment is a certain percentage of the fair market value that is determined by local assessors to be the total taxable value of land and additions on the property. | Land | Improvement |
|---|---|---|---|---|
| 2024 | $11,242 | $187,290 | $78,540 | $108,750 |
| 2023 | $11,107 | $187,285 | $78,540 | $108,745 |
| 2022 | $10,780 | $149,770 | $58,350 | $91,420 |
| 2021 | $9,745 | $149,770 | $58,350 | $91,420 |
| 2020 | $9,332 | $149,770 | $58,350 | $91,420 |
| 2019 | $8,211 | $127,160 | $58,350 | $68,810 |
| 2018 | $7,058 | $127,160 | $58,350 | $68,810 |
| 2017 | $7,053 | $127,160 | $58,350 | $68,810 |
| 2016 | $5,957 | $98,850 | $37,770 | $61,080 |
| 2015 | $5,952 | $98,850 | $37,770 | $61,080 |
| 2014 | $5,959 | $98,850 | $37,770 | $61,080 |
| 2013 | $2,817 | $89,845 | $34,335 | $55,510 |
Source: Public Records
Map
Nearby Homes
- 2276 Johnston Rd
- 2276 Hoxton Ct
- 3918 Hillview Dr
- 4115 Woodbridge Rd
- 2300 Hoxton Ct
- 3804 Mountview Rd
- 3920 Overdale Dr
- 2195 Edgevale Rd
- 2081 Fishinger Rd
- 3701 Reed Rd
- 2413 Edgevale Rd
- 2308 Shrewsbury Rd
- 3509 Redding Rd
- 3600 Reed Rd Unit 15
- 2401 Shrewsbury Rd
- 4450 Haverford Ct
- 2443 Shrewsbury Rd
- 2424 Nottingham Rd
- 4094 Lyon Dr
- 2162 Oakmount Rd
- 3971 Woodbridge Rd
- 2220 Lytham Rd
- 3980 Chelton Place
- 3931 Woodbridge Rd
- 3950 Lytham Ct
- 3950 Lytham Ct
- 3950 Woodbridge Rd
- 2211 Lytham Rd
- 3985 Woodbridge Rd
- 3968 Woodbridge Rd
- 3992 Chelton Place
- 2221 Lytham Rd
- 3930 Woodbridge Rd
- 3984 Woodbridge Rd
- 3999 Woodbridge Rd
- 2233 Lytham Rd
- 2169 Lytham Rd
- 2240 Lytham Rd
- 4004 Chelton Place
- 2154 Lytham Rd