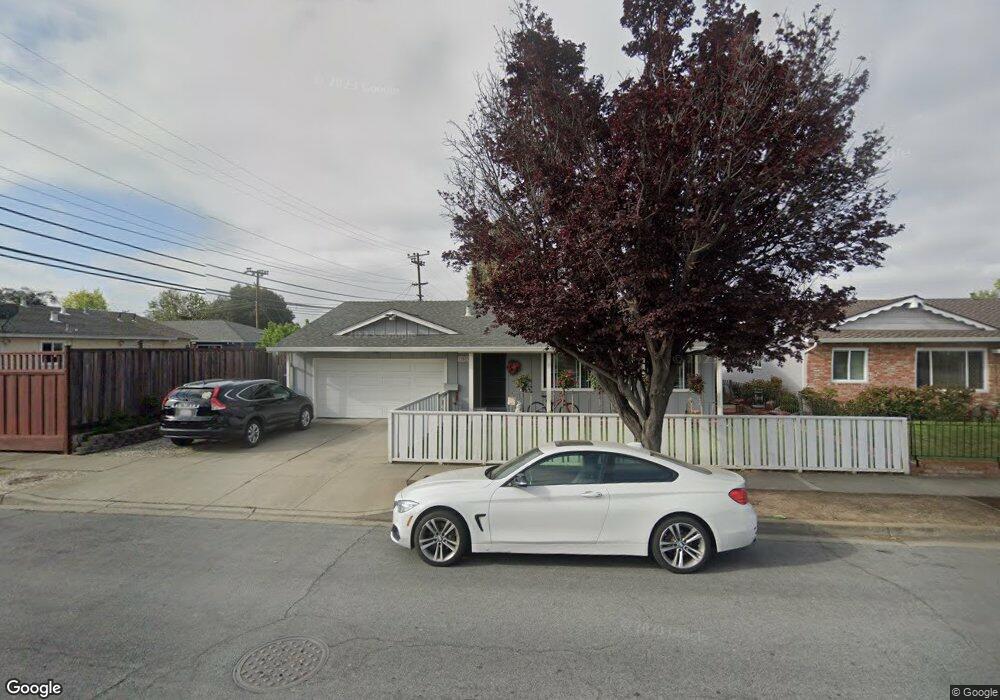
39599 Logan Dr Fremont, CA 94538
Sundale NeighborhoodEstimated Value: $1,422,000 - $1,672,771
4
Beds
3
Baths
1,719
Sq Ft
$925/Sq Ft
Est. Value
About This Home
This home is located at 39599 Logan Dr, Fremont, CA 94538 and is currently estimated at $1,589,443, approximately $924 per square foot. 39599 Logan Dr is a home located in Alameda County with nearby schools including Brier Elementary School, G.M. Walters Middle School, and John F. Kennedy High School.
Ownership History
Date
Name
Owned For
Owner Type
Purchase Details
Closed on
Mar 27, 2013
Sold by
Hansen James B and Hansen Becky L
Bought by
Huang Shihming and Li Yan
Current Estimated Value
Home Financials for this Owner
Home Financials are based on the most recent Mortgage that was taken out on this home.
Original Mortgage
$472,000
Outstanding Balance
$333,469
Interest Rate
3.49%
Mortgage Type
New Conventional
Estimated Equity
$1,255,974
Purchase Details
Closed on
Apr 4, 1994
Sold by
Citibank
Bought by
Hansen James B and Hansen Becky L
Home Financials for this Owner
Home Financials are based on the most recent Mortgage that was taken out on this home.
Original Mortgage
$194,850
Interest Rate
7.38%
Purchase Details
Closed on
Oct 27, 1993
Sold by
Standard Trust Deed Service Company
Bought by
Citibank
Purchase Details
Closed on
Sep 27, 1993
Sold by
Johnson Warren M
Bought by
Johnson Mya Rachelle
Create a Home Valuation Report for This Property
The Home Valuation Report is an in-depth analysis detailing your home's value as well as a comparison with similar homes in the area
Home Values in the Area
Average Home Value in this Area
Purchase History
| Date | Buyer | Sale Price | Title Company |
|---|---|---|---|
| Huang Shihming | $590,000 | Fidelity National Title Co | |
| Hansen James B | $216,500 | First American Title Grnty C | |
| Citibank | $180,200 | -- | |
| Johnson Mya Rachelle | -- | -- |
Source: Public Records
Mortgage History
| Date | Status | Borrower | Loan Amount |
|---|---|---|---|
| Open | Huang Shihming | $472,000 | |
| Previous Owner | Hansen James B | $194,850 |
Source: Public Records
Tax History Compared to Growth
Tax History
| Year | Tax Paid | Tax Assessment Tax Assessment Total Assessment is a certain percentage of the fair market value that is determined by local assessors to be the total taxable value of land and additions on the property. | Land | Improvement |
|---|---|---|---|---|
| 2025 | $8,848 | $722,927 | $217,954 | $511,973 |
| 2024 | $8,848 | $708,617 | $213,681 | $501,936 |
| 2023 | $8,607 | $701,586 | $209,491 | $492,095 |
| 2022 | $8,491 | $680,834 | $205,385 | $482,449 |
| 2021 | $8,283 | $667,348 | $201,358 | $472,990 |
| 2020 | $8,291 | $667,436 | $199,294 | $468,142 |
| 2019 | $8,196 | $654,354 | $195,388 | $458,966 |
| 2018 | $8,000 | $638,527 | $191,558 | $446,969 |
| 2017 | $7,799 | $626,007 | $187,802 | $438,205 |
| 2016 | $7,663 | $613,734 | $184,120 | $429,614 |
| 2015 | $7,559 | $604,518 | $181,355 | $423,163 |
| 2014 | $7,443 | $592,678 | $177,803 | $414,875 |
Source: Public Records
Map
Nearby Homes
- 4692 Nelson St
- 39530 Dorrington Ct
- 4600 Nelson St
- 4737 Boone Dr
- 4714 Serra Ave
- 5033 Blacksand Rd
- 39090 Presidio Way Unit 237
- 39753 Placer Way
- 40116 Crockett St
- 5330 Coco Palm Dr
- 39751 Bissy Common
- 4840 Piper St
- 5589 Roosevelt Place
- 4715 Mildred Dr
- 5580 Hemlock Terrace
- 4453 Porter St
- 39993 Fremont Blvd Unit 102
- 4572 De Silva St
- 3909 Stevenson Blvd Unit 402
- 39134 Memorial St
- 39583 Logan Dr
- 39309 Sundale Dr
- 39321 Sundale Dr
- 39572 Wilford Ct
- 39567 Logan Dr
- 39333 Sundale Dr
- 39560 Wilford Ct
- 39598 Logan Dr
- 39295 Sundale Dr
- 39584 Logan Dr
- 39589 Wilford Ct
- 39345 Sundale Dr
- 39551 Logan Dr
- 39548 Wilford Ct
- 39550 Logan Dr
- 39287 Sundale Dr
- 39357 Sundale Dr
- 39535 Logan Dr
- 39308 Sundale Dr
- 39320 Sundale Dr