Estimated Value: $506,000 - $599,000
4
Beds
2
Baths
1,922
Sq Ft
$283/Sq Ft
Est. Value
About This Home
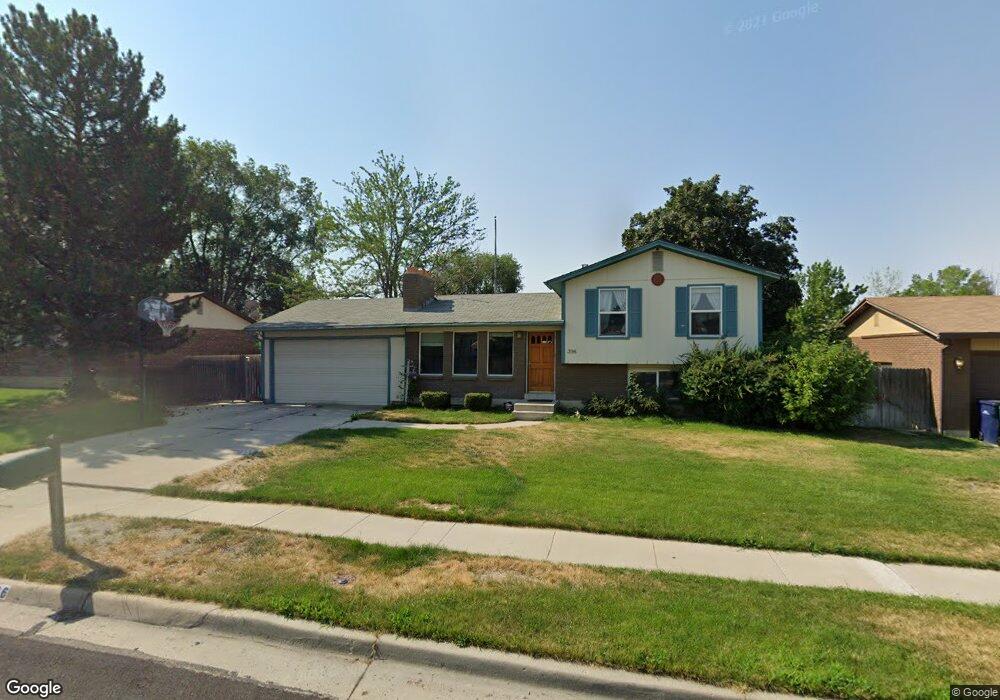
This home is located at 396 E 10105 S, Sandy, UT 84070 and is currently estimated at $543,474, approximately $282 per square foot. 396 E 10105 S is a home located in Salt Lake County with nearby schools including Alta View Elementary School, Jordan High, and Mount Jordan Middle School.
Ownership History
Date
Name
Owned For
Owner Type
Purchase Details
Closed on
Jan 23, 2007
Sold by
Smith Bradley T and Smith Sangsoon T
Bought by
Smith Bradley T
Current Estimated Value
Home Financials for this Owner
Home Financials are based on the most recent Mortgage that was taken out on this home.
Original Mortgage
$198,000
Outstanding Balance
$117,598
Interest Rate
6.1%
Mortgage Type
New Conventional
Estimated Equity
$425,876
Purchase Details
Closed on
Mar 29, 2004
Sold by
Rogers Gary I and Rogers Rebecca A
Bought by
Smith Bradley T and Smith Sangsoon T
Home Financials for this Owner
Home Financials are based on the most recent Mortgage that was taken out on this home.
Original Mortgage
$132,080
Interest Rate
5.64%
Mortgage Type
Purchase Money Mortgage
Create a Home Valuation Report for This Property
The Home Valuation Report is an in-depth analysis detailing your home's value as well as a comparison with similar homes in the area
Home Values in the Area
Average Home Value in this Area
Purchase History
| Date | Buyer | Sale Price | Title Company |
|---|---|---|---|
| Smith Bradley T | -- | Executive Title Ins Agency | |
| Smith Bradley T | -- | Accommodation | |
| Smith Bradley T | -- | Equity Title |
Source: Public Records
Mortgage History
| Date | Status | Borrower | Loan Amount |
|---|---|---|---|
| Open | Smith Bradley T | $198,000 | |
| Closed | Smith Bradley T | $132,080 | |
| Closed | Smith Bradley T | $33,020 |
Source: Public Records
Tax History
| Year | Tax Paid | Tax Assessment Tax Assessment Total Assessment is a certain percentage of the fair market value that is determined by local assessors to be the total taxable value of land and additions on the property. | Land | Improvement |
|---|---|---|---|---|
| 2025 | $2,326 | $458,700 | $124,800 | $333,900 |
| 2024 | $2,326 | $439,800 | $119,100 | $320,700 |
| 2023 | $2,326 | $428,900 | $113,200 | $315,700 |
| 2022 | $2,436 | $440,000 | $111,000 | $329,000 |
| 2021 | $2,121 | $333,600 | $85,900 | $247,700 |
| 2020 | $2,021 | $300,200 | $85,900 | $214,300 |
| 2019 | $2,001 | $290,000 | $81,100 | $208,900 |
| 2018 | $1,647 | $249,700 | $81,100 | $168,600 |
| 2017 | $1,647 | $239,000 | $81,100 | $157,900 |
| 2016 | $1,692 | $237,500 | $81,100 | $156,400 |
| 2015 | $1,594 | $207,500 | $78,600 | $128,900 |
| 2014 | $1,557 | $199,100 | $76,200 | $122,900 |
Source: Public Records
Map
Nearby Homes
- 409 E 10185 S
- 9822 S Darin Dr
- 586 E 10345 S
- 569 E Aloha Ln
- 574 E 10425 S
- 262 E Sandy Sage Way
- 375 E 10560 S
- 601 E Pali St
- 10556 S Sandy Sage Way
- 8475 S State St
- 10351 S Zinnia Way
- 717 Sand Dollar Dr
- 10564 S Weeping Willow Dr
- 77 W Evening Star Way
- 845 Larkspur Dr
- 10491 Amaryllis St
- 10522 Amaryllis St
- 10510 S State St
- 101 E Rembrandt Cir
- 837 E 10515 S
Your Personal Tour Guide
Ask me questions while you tour the home.