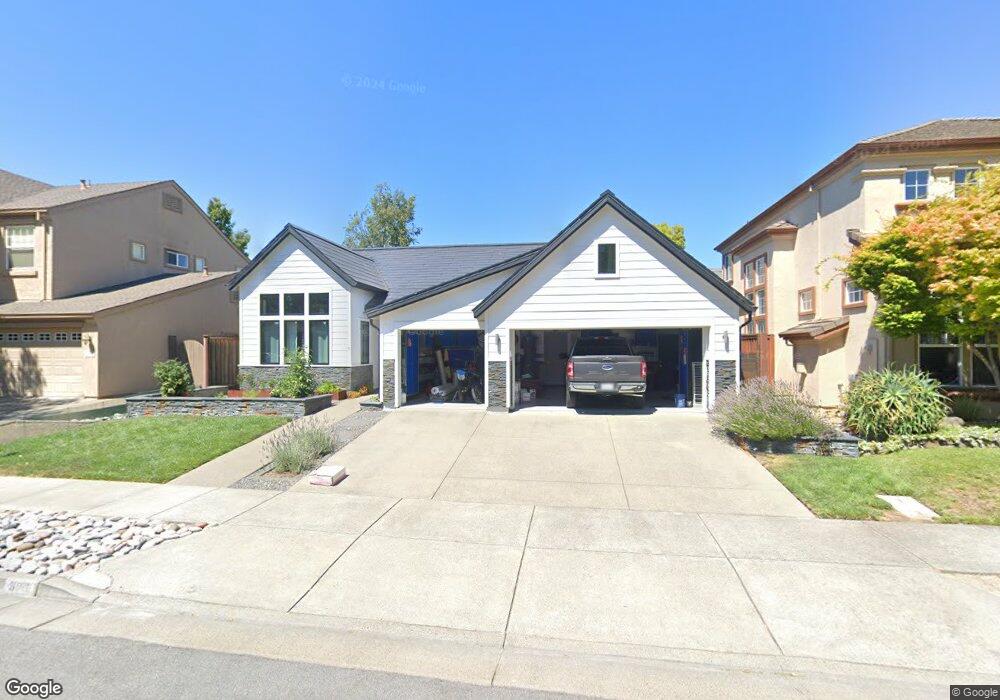
396 Song Bird Way Petaluma, CA 94954
College Heights NeighborhoodEstimated Value: $955,000 - $1,230,000
3
Beds
2
Baths
1,985
Sq Ft
$533/Sq Ft
Est. Value
About This Home
This home is located at 396 Song Bird Way, Petaluma, CA 94954 and is currently estimated at $1,057,590, approximately $532 per square foot. 396 Song Bird Way is a home located in Sonoma County with nearby schools including Kenilworth Junior High School, Casa Grande High School, and Sonoma Mountain Elementary School.
Ownership History
Date
Name
Owned For
Owner Type
Purchase Details
Closed on
May 3, 2024
Sold by
Penzenstadler Elizabeth A and Bolek Martin F
Bought by
Bolek 2024 Trust and Bolek
Current Estimated Value
Purchase Details
Closed on
Nov 16, 2001
Sold by
Bolek Martin F and Bolek Elizabeth A
Bought by
Bolek Martin F and Bolek Elizabeth A
Home Financials for this Owner
Home Financials are based on the most recent Mortgage that was taken out on this home.
Original Mortgage
$288,000
Interest Rate
5.37%
Purchase Details
Closed on
Mar 29, 2000
Sold by
Mickelsen Max and Mickelsen Joni
Bought by
Bolek Martin F and Penzenstadler Elizabeth A
Home Financials for this Owner
Home Financials are based on the most recent Mortgage that was taken out on this home.
Original Mortgage
$300,000
Interest Rate
7.5%
Create a Home Valuation Report for This Property
The Home Valuation Report is an in-depth analysis detailing your home's value as well as a comparison with similar homes in the area
Home Values in the Area
Average Home Value in this Area
Purchase History
| Date | Buyer | Sale Price | Title Company |
|---|---|---|---|
| Bolek 2024 Trust | -- | None Listed On Document | |
| Bolek Martin F | -- | Old Republic Title Company | |
| Bolek Martin F | $368,954 | Sonoma Title Guaranty Compan |
Source: Public Records
Mortgage History
| Date | Status | Borrower | Loan Amount |
|---|---|---|---|
| Previous Owner | Bolek Martin F | $288,000 | |
| Previous Owner | Bolek Martin F | $300,000 | |
| Closed | Bolek Martin F | $59,700 | |
| Closed | Bolek Martin F | $79,700 |
Source: Public Records
Tax History Compared to Growth
Tax History
| Year | Tax Paid | Tax Assessment Tax Assessment Total Assessment is a certain percentage of the fair market value that is determined by local assessors to be the total taxable value of land and additions on the property. | Land | Improvement |
|---|---|---|---|---|
| 2025 | $6,444 | $581,892 | $242,839 | $339,053 |
| 2024 | $6,444 | $570,483 | $238,078 | $332,405 |
| 2023 | $6,444 | $559,298 | $233,410 | $325,888 |
| 2022 | $6,291 | $548,333 | $228,834 | $319,499 |
| 2021 | $6,215 | $537,583 | $224,348 | $313,235 |
| 2020 | $6,255 | $532,072 | $222,048 | $310,024 |
| 2019 | $6,189 | $521,641 | $217,695 | $303,946 |
| 2018 | $6,011 | $511,414 | $213,427 | $297,987 |
| 2017 | $5,924 | $501,388 | $209,243 | $292,145 |
| 2016 | $5,745 | $491,558 | $205,141 | $286,417 |
| 2015 | $5,598 | $484,175 | $202,060 | $282,115 |
| 2014 | $5,542 | $474,691 | $198,102 | $276,589 |
Source: Public Records
Map
Nearby Homes
- 112 Rose Petal Ct
- 1645 Lauren Dr
- 1638 Lauren Dr
- 1705 Clairmont Ct
- 1785 Pine Ave
- 402 Barons Way
- 2013 Knight Ave
- 523 Greenwich St
- 1688 Kearny Ct
- 2044 Willow Dr
- 206 Park Place Dr
- 2053 Vista Ln
- 29 Palomino Ct
- 228 S Mcdowell Blvd
- 73 Alta Dr
- 104 Banff Way
- 642 Albert Way
- 29 Alta Dr
- 72 Oakwood Dr
- 529 Rosewood Cir
- 392 Song Bird Way
- 400 Song Bird Way
- 397 Sparrow Ln
- 393 Sparrow Ln
- 401 Sparrow Ln
- 388 Song Bird Way
- 404 Song Bird Way
- 397 Song Bird Way
- 393 Song Bird Way
- 389 Sparrow Ln
- 405 Sparrow Ln
- 401 Song Bird Way
- 389 Song Bird Way
- 384 Song Bird Way
- 405 Song Bird Way
- 385 Song Bird Way
- 385 Sparrow Ln
- 396 Sparrow Ln
- 396 Raven Way
- 392 Raven Way