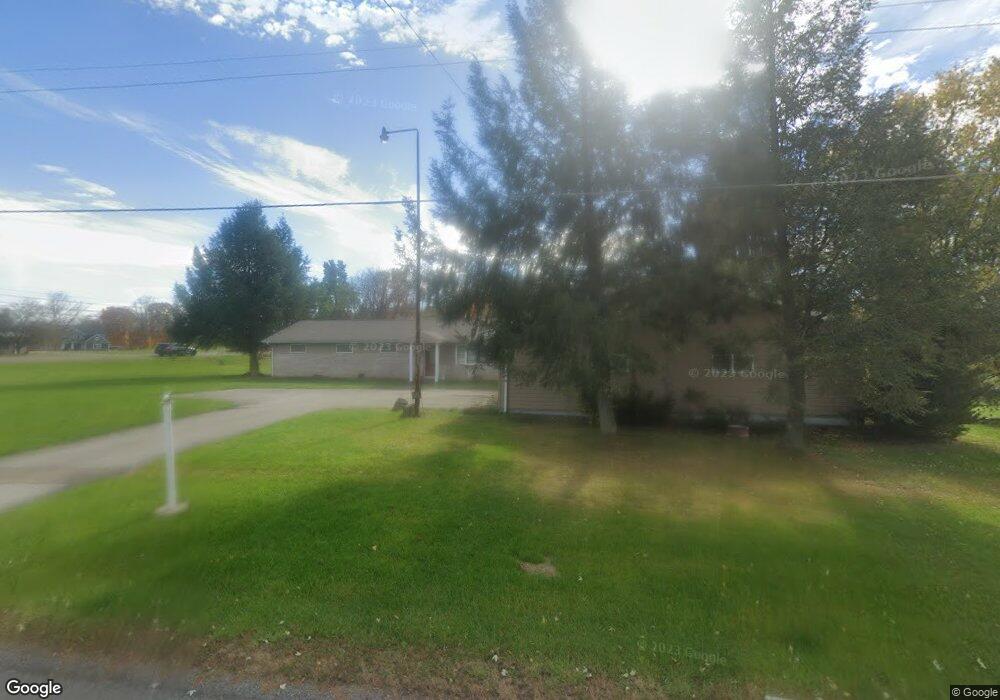
396 Walkchalk Rd Kittanning, PA 16201
East Franklin Township NeighborhoodEstimated Value: $187,000 - $330,000
3
Beds
3
Baths
1,456
Sq Ft
$167/Sq Ft
Est. Value
About This Home
This home is located at 396 Walkchalk Rd, Kittanning, PA 16201 and is currently estimated at $243,662, approximately $167 per square foot. 396 Walkchalk Rd is a home with nearby schools including West Hills Intermediate School, West Hills Primary School, and Harvest Christian School.
Ownership History
Date
Name
Owned For
Owner Type
Purchase Details
Closed on
Mar 17, 2009
Sold by
Bank Of America Na
Bought by
Jones David A and Goodman Lachelle D
Current Estimated Value
Home Financials for this Owner
Home Financials are based on the most recent Mortgage that was taken out on this home.
Original Mortgage
$93,279
Outstanding Balance
$59,689
Interest Rate
5.25%
Mortgage Type
FHA
Estimated Equity
$183,973
Purchase Details
Closed on
Nov 20, 2008
Sold by
Cousins Ralph A
Bought by
Bank Of America Na
Purchase Details
Closed on
Oct 27, 2006
Sold by
Lukehart Randy D and Lukehart Jacqueline R
Bought by
Cousins Ralph A
Home Financials for this Owner
Home Financials are based on the most recent Mortgage that was taken out on this home.
Original Mortgage
$33,300
Interest Rate
6.02%
Mortgage Type
New Conventional
Create a Home Valuation Report for This Property
The Home Valuation Report is an in-depth analysis detailing your home's value as well as a comparison with similar homes in the area
Home Values in the Area
Average Home Value in this Area
Purchase History
| Date | Buyer | Sale Price | Title Company |
|---|---|---|---|
| Jones David A | $95,000 | None Available | |
| Bank Of America Na | $781 | None Available | |
| Cousins Ralph A | $166,500 | None Available |
Source: Public Records
Mortgage History
| Date | Status | Borrower | Loan Amount |
|---|---|---|---|
| Open | Jones David A | $93,279 | |
| Previous Owner | Cousins Ralph A | $33,300 |
Source: Public Records
Tax History Compared to Growth
Tax History
| Year | Tax Paid | Tax Assessment Tax Assessment Total Assessment is a certain percentage of the fair market value that is determined by local assessors to be the total taxable value of land and additions on the property. | Land | Improvement |
|---|---|---|---|---|
| 2025 | $5,247 | $59,160 | $33,710 | $25,450 |
| 2024 | $4,952 | $59,160 | $33,710 | $25,450 |
| 2023 | $4,031 | $59,160 | $33,710 | $25,450 |
| 2022 | $4,031 | $59,160 | $33,710 | $25,450 |
| 2021 | $4,031 | $59,160 | $33,710 | $25,450 |
| 2020 | $4,031 | $59,160 | $33,710 | $25,450 |
| 2019 | $4,043 | $59,160 | $33,710 | $25,450 |
| 2018 | $4,038 | $48,160 | $11,810 | $36,350 |
| 2017 | $4,009 | $59,160 | $33,710 | $25,450 |
| 2016 | $4,009 | $59,160 | $33,710 | $25,450 |
| 2015 | $3,588 | $59,160 | $33,710 | $25,450 |
| 2014 | $3,588 | $59,160 | $33,710 | $25,450 |
Source: Public Records
Map
Nearby Homes
- 487 E Brady Rd
- 336 Walkchalk Rd
- 397 E Brady Rd
- 334 Lemmon Hollow Rd
- 223 Cedar Dr
- 1409 Orr Ave
- 536 1/2 Butler Rd
- 0 Wible Rd
- 1033 Wilson Ave
- 1017 Johnston Ave
- 935 Orr Ave
- 422-424 Highland Ave
- 418 Pine Hill Rd
- 509 N Jefferson St
- 1039 Glade Park E
- 435 1/2 Reesman Dr Unit 2
- 208 Briar Hill Rd
- 217 Briar Hill Rd
- 166 Clearfield Pike
- 121 Oak Ave
- 401 Walkchalk Rd
- 393 Walkchalk Rd
- 448 East Brady Rd
- 386 Walkchalk Rd
- 103 State Route 2007
- 106 Shay Rd
- 382 Walkchalk Rd
- 385 Walkchalk Rd
- 463 East Brady Rd
- 435 East Brady Rd
- 376 Walkchalk Rd
- 114 Shay Rd
- 431 East Brady Rd
- 372 Walkchalk Rd
- 373 Walkchalk Rd
- 474 East Brady Rd
- 478 East Brady Rd
- 368 Walkchalk Rd
- 100 Montgomery Rd
- 363 Walkchalk Rd