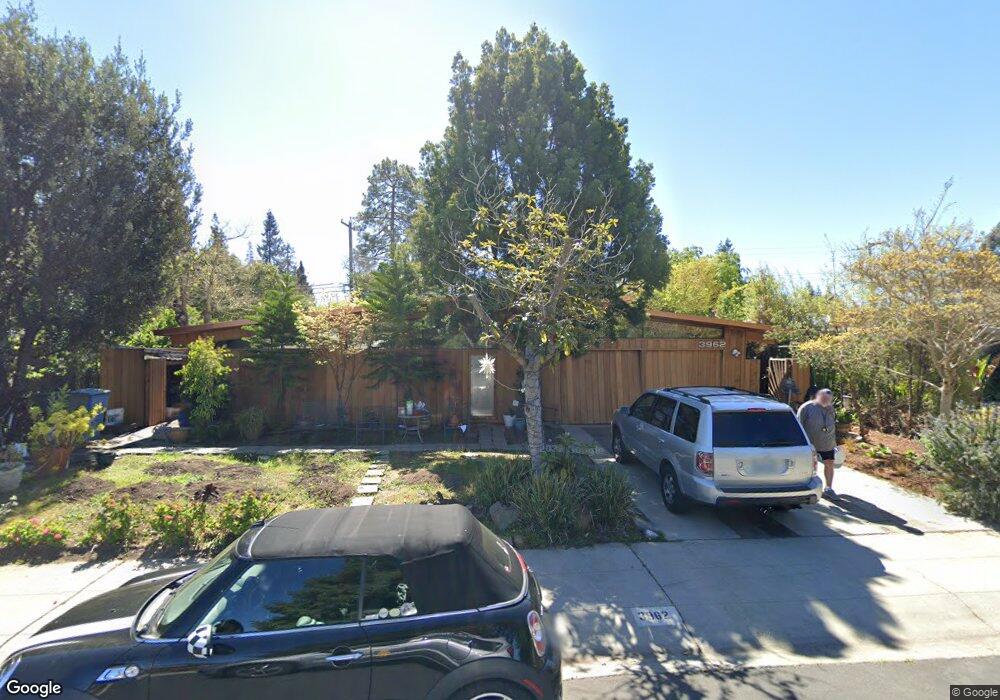
3962 Nelson Ct Palo Alto, CA 94306
Greenmeadow NeighborhoodEstimated Value: $3,444,000 - $3,903,000
4
Beds
3
Baths
1,995
Sq Ft
$1,850/Sq Ft
Est. Value
About This Home
This home is located at 3962 Nelson Ct, Palo Alto, CA 94306 and is currently estimated at $3,690,271, approximately $1,849 per square foot. 3962 Nelson Ct is a home located in Santa Clara County with nearby schools including Fairmeadow Elementary School, Jane Lathrop Stanford Middle School, and Henry M. Gunn High School.
Ownership History
Date
Name
Owned For
Owner Type
Purchase Details
Closed on
May 24, 2024
Sold by
Fortune Daniel and Daniel Fortune Revocable Living Trust
Bought by
Daniel Fortune And Veneracion E Lyon Revocabl and Fortune
Current Estimated Value
Home Financials for this Owner
Home Financials are based on the most recent Mortgage that was taken out on this home.
Original Mortgage
$1,724,737
Outstanding Balance
$1,450,189
Interest Rate
3.9%
Mortgage Type
Reverse Mortgage Home Equity Conversion Mortgage
Estimated Equity
$2,240,082
Purchase Details
Closed on
Nov 14, 2017
Sold by
Fortune Daniel
Bought by
Fortiune Daniel
Home Financials for this Owner
Home Financials are based on the most recent Mortgage that was taken out on this home.
Original Mortgage
$954,225
Interest Rate
4.92%
Mortgage Type
Reverse Mortgage Home Equity Conversion Mortgage
Purchase Details
Closed on
Dec 11, 2006
Sold by
Fortune Daniel
Bought by
Fortune Daniel
Create a Home Valuation Report for This Property
The Home Valuation Report is an in-depth analysis detailing your home's value as well as a comparison with similar homes in the area
Home Values in the Area
Average Home Value in this Area
Purchase History
| Date | Buyer | Sale Price | Title Company |
|---|---|---|---|
| Daniel Fortune And Veneracion E Lyon Revocabl | -- | Realeo Title Company | |
| Fortiune Daniel | -- | Placer Title Co | |
| Fortune Daniel | -- | None Available |
Source: Public Records
Mortgage History
| Date | Status | Borrower | Loan Amount |
|---|---|---|---|
| Open | Daniel Fortune And Veneracion E Lyon Revocabl | $1,724,737 | |
| Closed | Daniel Fortune And Veneracion E Lyon Revocabl | $1,724,737 | |
| Previous Owner | Fortiune Daniel | $954,225 |
Source: Public Records
Tax History Compared to Growth
Tax History
| Year | Tax Paid | Tax Assessment Tax Assessment Total Assessment is a certain percentage of the fair market value that is determined by local assessors to be the total taxable value of land and additions on the property. | Land | Improvement |
|---|---|---|---|---|
| 2025 | $7,087 | $527,113 | $283,082 | $244,031 |
| 2024 | $7,087 | $516,779 | $277,532 | $239,247 |
| 2023 | $6,979 | $506,647 | $272,091 | $234,556 |
| 2022 | $6,891 | $496,713 | $266,756 | $229,957 |
| 2021 | $6,754 | $486,975 | $261,526 | $225,449 |
| 2020 | $6,630 | $481,983 | $258,845 | $223,138 |
| 2019 | $6,552 | $472,533 | $253,770 | $218,763 |
| 2018 | $6,389 | $463,269 | $248,795 | $214,474 |
| 2017 | $6,194 | $454,186 | $243,917 | $210,269 |
| 2016 | $6,025 | $445,282 | $239,135 | $206,147 |
| 2015 | $5,959 | $438,594 | $235,543 | $203,051 |
| 2014 | $5,757 | $430,004 | $230,930 | $199,074 |
Source: Public Records
Map
Nearby Homes
- 418 Ferne Ave
- 4225 Park Blvd
- 3946 Louis Rd
- 26 Roosevelt Cir
- 444 San Antonio Rd Unit 1A
- 795 E Charleston Rd
- 342 Carolina Ln
- 777 San Antonio Rd Unit 93
- 773 E Meadow Dr
- 181 Del Medio Ave Unit 307
- 4206 Rickeys Way Unit C
- 701 Christine Dr
- 3428 Alma Village Cir
- 432 Victory Ave
- 2255 Showers Dr Unit 152
- 4173 El Camino Real Unit 1
- 2474 Alvin St
- 4115 El Camino Real Unit 222
- 4115 El Camino Real Unit 333
- 4115 El Camino Real Unit 332
- 3964 Nelson Ct
- 3960 Nelson Ct
- 451 Adobe Place
- 431 Adobe Place
- 3948 Nelson Ct
- 3958 Nelson Ct
- 3950 Nelson Ct
- 421 Adobe Place
- 3945 Nelson Dr
- 3956 Nelson Ct
- 3946 Nelson Dr
- 3954 Nelson Ct
- 3952 Nelson Ct
- 470 El Capitan Place
- 411 Adobe Place
- 440 Adobe Place
- 3942 Nelson Dr
- 450 Adobe Place
- 430 Adobe Place
- 460 El Capitan Place