Estimated Value: $282,096 - $323,000
3
Beds
3
Baths
1,768
Sq Ft
$170/Sq Ft
Est. Value
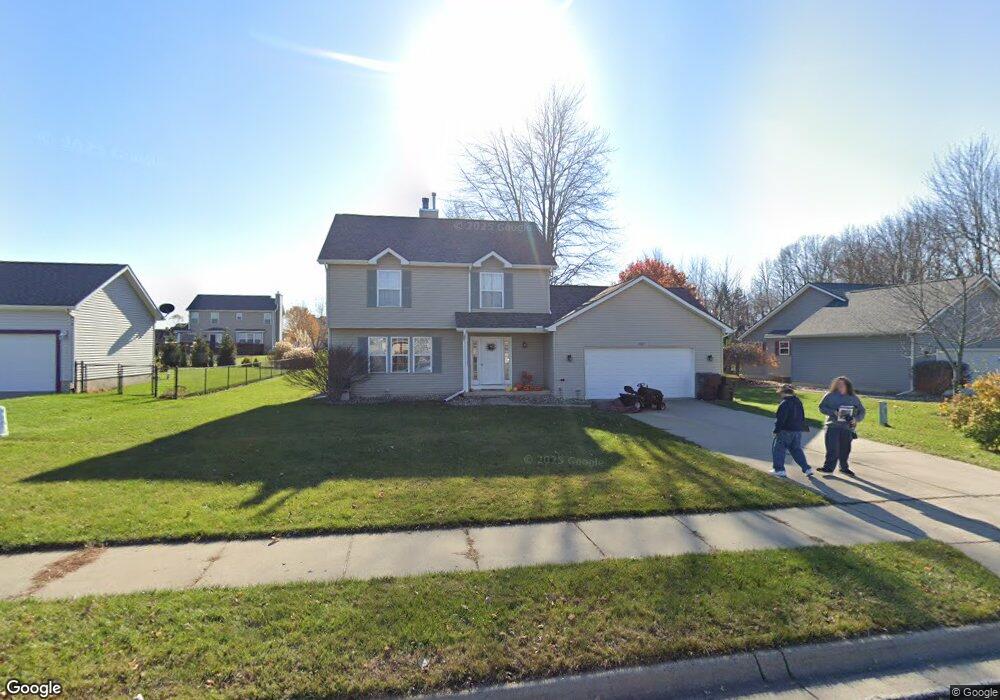
About This Home
This home is located at 3963 Keller Rd, Holt, MI 48842 and is currently estimated at $300,774, approximately $170 per square foot. 3963 Keller Rd is a home located in Ingham County with nearby schools including Sycamore Elementary School, Hope Middle School, and Holt Junior High School.
Ownership History
Date
Name
Owned For
Owner Type
Purchase Details
Closed on
Jul 29, 2005
Sold by
Wabaunsee Will J and Wabaunsee Amy R
Bought by
Alexander Mark and Alexander Annalee
Current Estimated Value
Home Financials for this Owner
Home Financials are based on the most recent Mortgage that was taken out on this home.
Original Mortgage
$175,249
Outstanding Balance
$92,061
Interest Rate
5.66%
Mortgage Type
FHA
Estimated Equity
$208,713
Purchase Details
Closed on
Feb 9, 2000
Sold by
Mastin Randy and Mastin Barbara Watts
Bought by
Wabaunsee Will J and Wabaunsee Amy R
Home Financials for this Owner
Home Financials are based on the most recent Mortgage that was taken out on this home.
Original Mortgage
$133,950
Interest Rate
8.16%
Mortgage Type
Purchase Money Mortgage
Purchase Details
Closed on
Jun 3, 1999
Sold by
Old Kent Bank
Bought by
Mastin Randy
Create a Home Valuation Report for This Property
The Home Valuation Report is an in-depth analysis detailing your home's value as well as a comparison with similar homes in the area
Home Values in the Area
Average Home Value in this Area
Purchase History
| Date | Buyer | Sale Price | Title Company |
|---|---|---|---|
| Alexander Mark | $178,000 | Chicago Title Lansing | |
| Wabaunsee Will J | $141,000 | First American Title Ins Co | |
| Mastin Randy | $35,000 | First American Title |
Source: Public Records
Mortgage History
| Date | Status | Borrower | Loan Amount |
|---|---|---|---|
| Open | Alexander Mark | $175,249 | |
| Previous Owner | Wabaunsee Will J | $133,950 |
Source: Public Records
Tax History
| Year | Tax Paid | Tax Assessment Tax Assessment Total Assessment is a certain percentage of the fair market value that is determined by local assessors to be the total taxable value of land and additions on the property. | Land | Improvement |
|---|---|---|---|---|
| 2025 | $5,446 | $127,900 | $24,600 | $103,300 |
| 2024 | $12 | $122,600 | $22,100 | $100,500 |
| 2023 | $4,759 | $113,800 | $20,000 | $93,800 |
| 2022 | $4,538 | $105,100 | $17,500 | $87,600 |
| 2021 | $4,440 | $99,900 | $13,900 | $86,000 |
| 2020 | $4,524 | $94,200 | $13,900 | $80,300 |
| 2019 | $4,677 | $91,400 | $13,900 | $77,500 |
| 2018 | $4,653 | $86,000 | $13,600 | $72,400 |
| 2017 | $4,047 | $86,000 | $13,600 | $72,400 |
| 2016 | $3,973 | $83,400 | $13,600 | $69,800 |
| 2015 | $3,951 | $79,300 | $39,000 | $40,300 |
| 2014 | $3,951 | $75,900 | $39,000 | $36,900 |
Source: Public Records
Map
Nearby Homes
- 2320 Tiffany Ln
- 3860 Knotwood Dr
- 2145 Park Ln
- 2545 Hummingbird Ln
- 2612 Navigator Ln
- 2617 Navigator Ln
- 2529 Limerick Cir Unit 2
- 2668 Maritime Dr
- 2635 Navigator Ln
- 2650 Navigator Ln
- 2545 Limerick Cir Unit 8
- 2645 Navigator Ln
- 4360 Holt Rd Unit 9
- 2655 Navigator Ln
- 4094 Sebring Dr
- 4439 Keller Rd
- 4106 Sebring Dr
- 4118 Sebring Dr
- 0 Dell Rd Unit 290382
- 2611 Navigator
- 3953 Keller Rd
- 3973 Keller Rd
- 3964 Calypso Rd
- 3954 Calypso Rd
- 3960 Keller Rd
- 3950 Keller Rd
- 3970 Keller Rd
- 2225 Calypso Rd
- 3983 Keller Rd
- 3943 Keller Rd
- 3980 Keller Rd
- 3944 Calypso Rd
- 3940 Keller Rd
- 2219 Calypso Rd
- 3969 Calypso Rd
- 3989 Keller Rd
- 3933 Keller Rd
- 2287 Thornwood Dr
- 3990 Keller Rd
- 2281 Thornwood Dr
Your Personal Tour Guide
Ask me questions while you tour the home.