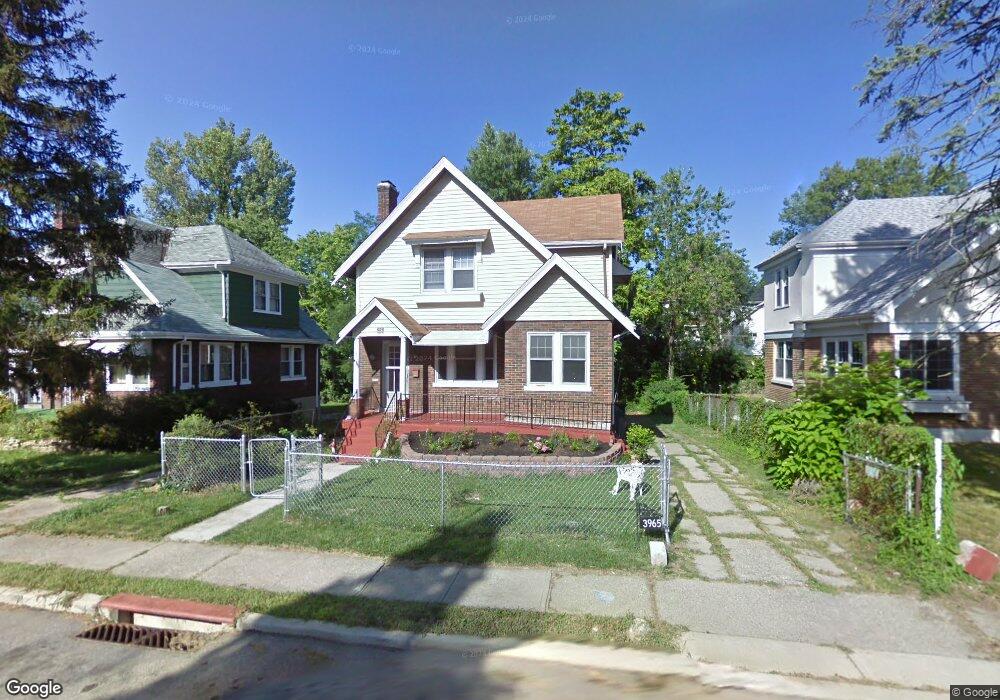
3965 Ardmore Ave Cincinnati, OH 45229
North Avondale NeighborhoodEstimated Value: $231,500 - $316,000
3
Beds
1
Bath
1,562
Sq Ft
$172/Sq Ft
Est. Value
About This Home
This home is located at 3965 Ardmore Ave, Cincinnati, OH 45229 and is currently estimated at $268,125, approximately $171 per square foot. 3965 Ardmore Ave is a home located in Hamilton County with nearby schools including South Avondale School, Clark Montessori High School, and Shroder High School.
Ownership History
Date
Name
Owned For
Owner Type
Purchase Details
Closed on
Aug 14, 2009
Sold by
Terry Nia
Bought by
Terry Nia and The Wilbur D Jones Revocable Living Trus
Current Estimated Value
Purchase Details
Closed on
May 15, 2002
Sold by
Jones Wilbur D
Bought by
Jones Wilbur D and Wilbur D Jones Revocable Living Trust
Purchase Details
Closed on
Nov 19, 2001
Sold by
Estate Of Elizabeth B Jones
Bought by
Jones Wilbur D
Create a Home Valuation Report for This Property
The Home Valuation Report is an in-depth analysis detailing your home's value as well as a comparison with similar homes in the area
Home Values in the Area
Average Home Value in this Area
Purchase History
| Date | Buyer | Sale Price | Title Company |
|---|---|---|---|
| Terry Nia | -- | Attorney | |
| Jones Wilbur D | -- | -- | |
| Jones Wilbur D | -- | -- |
Source: Public Records
Tax History
| Year | Tax Paid | Tax Assessment Tax Assessment Total Assessment is a certain percentage of the fair market value that is determined by local assessors to be the total taxable value of land and additions on the property. | Land | Improvement |
|---|---|---|---|---|
| 2025 | $3,070 | $49,697 | $14,249 | $35,448 |
| 2023 | $3,044 | $49,697 | $14,249 | $35,448 |
| 2022 | $2,417 | $35,361 | $10,070 | $25,291 |
| 2021 | $2,324 | $35,361 | $10,070 | $25,291 |
| 2020 | $2,392 | $35,361 | $10,070 | $25,291 |
| 2019 | $2,466 | $33,359 | $9,499 | $23,860 |
| 2018 | $2,470 | $33,359 | $9,499 | $23,860 |
| 2017 | $2,346 | $33,359 | $9,499 | $23,860 |
| 2016 | $2,682 | $37,632 | $9,499 | $28,133 |
| 2015 | $2,419 | $37,632 | $9,499 | $28,133 |
| 2014 | $2,436 | $37,632 | $9,499 | $28,133 |
| 2013 | $2,478 | $37,632 | $9,499 | $28,133 |
Source: Public Records
Map
Nearby Homes
- 3936 Dickson Ave
- 318 E Mitchell Ave
- 741 Red Bud Ave
- 739 Betula Ave
- 4 Burton Woods Ln
- 672 N Fred Shuttlesworth Cir
- 4009 Beechwood Ave
- 704 Greenwood Ave
- 708 Greenwood Ave
- 3923 Wess Park Dr
- 3990 Beechwood Ave
- 715 Greenwood Ave
- 421 Jefferson Ave
- 752 S Fred Shuttlesworth Cir
- 4238 Leonard Ave
- 537 Camden Ave
- 533 Camden Ave
- 3896 Reading Rd
- 4901 Chalet Dr
- 3967 Ardmore Ave
- 3959 Ardmore Ave
- 3969 Ardmore Ave
- 3952 Warwick Ave
- 3956 Warwick Ave
- 3948 Warwick Ave
- 3958 Warwick Ave
- 3944 Warwick Ave
- 3955 Ardmore Ave
- 3966 Ardmore Ave
- 3964 Ardmore Ave
- 3971 Ardmore Ave
- 3960 Warwick Ave
- 3968 Ardmore Ave
- 3962 Ardmore Ave
- 3940 Warwick Ave
- 3962 Warwick Ave
- 3940 Ardmore Ave
- 3935 Ardmore Ave
- 3973 Ardmore Ave
Your Personal Tour Guide
Ask me questions while you tour the home.