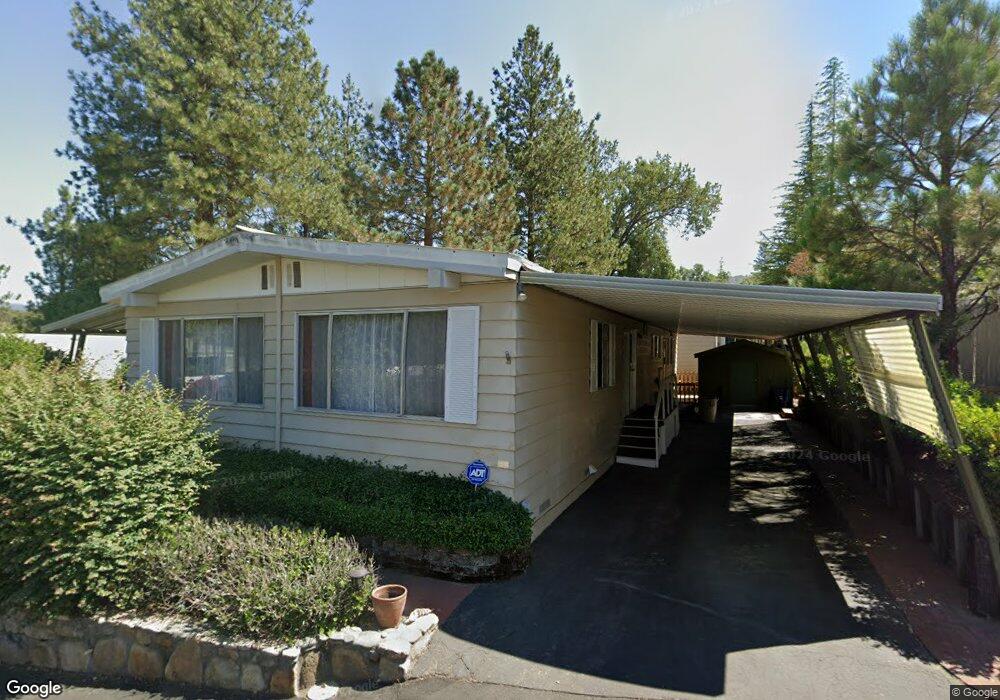
39678 Road 425b Oakhurst, CA 93644
Estimated Value: $92,500
1
Bed
1
Bath
2,692
Sq Ft
$34/Sq Ft
Est. Value
About This Home
This home is located at 39678 Road 425b, Oakhurst, CA 93644 and is currently priced at $92,500, approximately $34 per square foot. 39678 Road 425b is a home located in Madera County with nearby schools including Oakhurst Elementary School, Oak Creek Intermediate School, and Mountain Home School Charter.
Ownership History
Date
Name
Owned For
Owner Type
Purchase Details
Closed on
May 27, 2020
Sold by
Mayes Family Trust
Bought by
Oakhurst Mobile Home Estates L
Current Estimated Value
Purchase Details
Closed on
Jan 9, 2020
Sold by
Mayes Family Trust and Mayes John F
Bought by
Oakhurst Mobile Home Estates L
Purchase Details
Closed on
Oct 9, 2018
Sold by
Mayes Family Trust
Bought by
John F Mayes Trust
Purchase Details
Closed on
Sep 7, 2018
Sold by
Mayes Nadine C
Bought by
Mayes Robert Alan and Mayes John F
Purchase Details
Closed on
Dec 29, 2017
Sold by
Mayes Family Partnership Lp
Bought by
Survivors Trust
Purchase Details
Closed on
Dec 22, 2017
Sold by
Mayes Family Partnership Lp
Bought by
Survivors Trust and Exemption Trust
Purchase Details
Closed on
Nov 6, 2017
Sold by
Mayes Family Partneship L P
Bought by
Mayes Nadine C and Mayes John F
Create a Home Valuation Report for This Property
The Home Valuation Report is an in-depth analysis detailing your home's value as well as a comparison with similar homes in the area
Home Values in the Area
Average Home Value in this Area
Purchase History
| Date | Buyer | Sale Price | Title Company |
|---|---|---|---|
| Oakhurst Mobile Home Estates L | -- | None Listed On Document | |
| Oakhurst Mobile Home Estates L | -- | None Listed On Document | |
| John F Mayes Trust | -- | None Listed On Document | |
| Mayes Robert Alan | -- | None Available | |
| Survivors Trust | -- | None Listed On Document | |
| Survivors Trust | -- | None Listed On Document | |
| Mayes Nadine C | -- | None Available |
Source: Public Records
Tax History Compared to Growth
Tax History
| Year | Tax Paid | Tax Assessment Tax Assessment Total Assessment is a certain percentage of the fair market value that is determined by local assessors to be the total taxable value of land and additions on the property. | Land | Improvement |
|---|---|---|---|---|
| 2025 | $28,539 | $740,749 | $196,110 | $544,639 |
| 2023 | $28,539 | $715,406 | $188,496 | $526,910 |
| 2022 | $28,292 | $675,722 | $184,800 | $490,922 |
| 2021 | $28,105 | $684,224 | $181,177 | $503,047 |
| 2020 | $28,139 | $678,932 | $179,320 | $499,612 |
| 2019 | $28,043 | $668,636 | $175,804 | $492,832 |
| 2018 | $27,900 | $655,532 | $172,357 | $483,175 |
| 2017 | $27,778 | $643,986 | $168,978 | $475,008 |
| 2016 | $27,574 | $636,809 | $165,665 | $471,144 |
| 2015 | $27,484 | $623,544 | $163,177 | $460,367 |
| 2014 | $27,503 | $612,647 | $159,981 | $452,666 |
Source: Public Records
Map
Nearby Homes
- 39678 Road 425b Unit 93
- 39678 Road 425b Unit 90
- 39678 Road 425b Unit 60
- 39678 Road 425b Unit 45
- 49400 River Park Rd Unit 37
- 49400 River Park Rd Unit 45
- 49400 River Park Rd Unit 60
- 39979 Road 425b
- 39775 Pine Ridge Rd
- 48951 River Park Rd
- 48939 River Park Rd
- 48960 River Park Rd
- 39627 Brandywine Ln
- 40885 Elliott Dr
- 38950 California 41
- 48994 Manzanita Rd
- 49832 Road 426
- 0 Victoria Ln Unit 635265
- 0 Victoria Ln Unit 24036405
- 40411 Live Oak Dr
- 39678 Road 425b Unit 78
- 39678 Road 425b Unit 90
- 39678 Road 425b Unit 11
- 39678 Road 425b Unit 44
- 39678 Road 425b
- 39678 Road 425b Unit 16
- 39678 Road 425b Unit 8
- 39678 Road 425b Unit 48
- 39678 Road 425b Unit 28
- 39678 Road 425b Unit 71
- 39678 Road 425b Unit 25
- 39678 Road 425b Unit 81
- 39678 Road 425b Unit 45
- 39678 Road 425b Unit 51
- 39678 Road 425b Unit 10
- 39678 Road 425b Unit 59
- 39678 Road 425b Unit 79
- 39678 Road 425b Unit 62
- 39678 Road 425b Unit 43
- 39678 Road 425b Unit 74