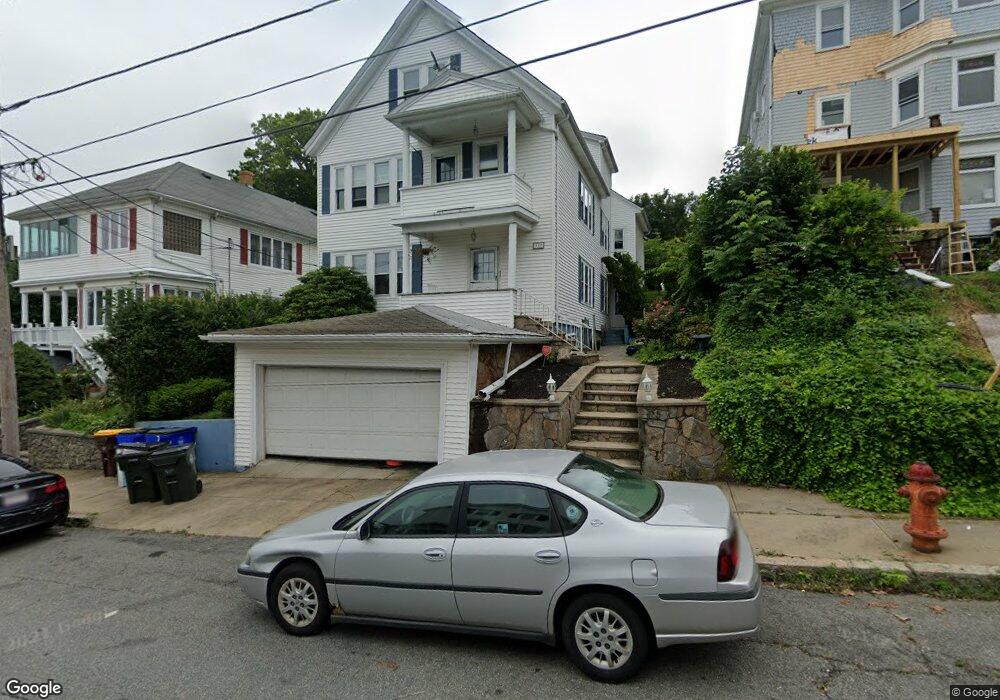
397 Belmont St Unit 2 Fall River, MA 02720
Lower Highlands NeighborhoodEstimated Value: $520,000 - $615,000
3
Beds
1
Bath
1,500
Sq Ft
$387/Sq Ft
Est. Value
About This Home
This home is located at 397 Belmont St Unit 2, Fall River, MA 02720 and is currently estimated at $579,807, approximately $386 per square foot. 397 Belmont St Unit 2 is a home located in Bristol County with nearby schools including Spencer Borden Elementary School, Morton Middle School, and B M C Durfee High School.
Ownership History
Date
Name
Owned For
Owner Type
Purchase Details
Closed on
Sep 28, 2007
Sold by
Pimental John J
Bought by
Winslow Kelly M and Winslow Lawrence
Current Estimated Value
Home Financials for this Owner
Home Financials are based on the most recent Mortgage that was taken out on this home.
Original Mortgage
$306,000
Outstanding Balance
$195,413
Interest Rate
6.65%
Mortgage Type
Purchase Money Mortgage
Estimated Equity
$384,394
Create a Home Valuation Report for This Property
The Home Valuation Report is an in-depth analysis detailing your home's value as well as a comparison with similar homes in the area
Home Values in the Area
Average Home Value in this Area
Purchase History
| Date | Buyer | Sale Price | Title Company |
|---|---|---|---|
| Winslow Kelly M | $306,000 | -- |
Source: Public Records
Mortgage History
| Date | Status | Borrower | Loan Amount |
|---|---|---|---|
| Open | Winslow Kelly M | $306,000 |
Source: Public Records
Tax History Compared to Growth
Tax History
| Year | Tax Paid | Tax Assessment Tax Assessment Total Assessment is a certain percentage of the fair market value that is determined by local assessors to be the total taxable value of land and additions on the property. | Land | Improvement |
|---|---|---|---|---|
| 2025 | $6,865 | $599,600 | $141,100 | $458,500 |
| 2024 | $6,252 | $544,100 | $135,700 | $408,400 |
| 2023 | $5,816 | $474,000 | $117,400 | $356,600 |
| 2022 | $5,356 | $424,400 | $109,700 | $314,700 |
| 2021 | $5,020 | $363,000 | $110,100 | $252,900 |
| 2020 | $4,524 | $313,100 | $110,300 | $202,800 |
| 2019 | $4,374 | $300,000 | $112,000 | $188,000 |
| 2018 | $3,943 | $269,700 | $112,000 | $157,700 |
| 2017 | $3,528 | $252,000 | $102,800 | $149,200 |
| 2016 | $3,386 | $248,400 | $102,800 | $145,600 |
| 2015 | $3,257 | $249,000 | $102,800 | $146,200 |
| 2014 | $3,204 | $254,700 | $95,900 | $158,800 |
Source: Public Records
Map
Nearby Homes
- 909 High St Unit 1
- 503 Highland Ave
- 771 Rock St
- 1245 N High St
- 327 Brownell St
- 376 N Underwood St
- 33-35 Malvey St
- 509 N Belmont St
- 1240-1246 N Main St
- 213 Weetamoe St
- 884-886 Robeson St
- 72 Belmont St
- 195 Barnaby St
- 110 Weetamoe St
- 100 Weetamoe St
- 11 Dyer St
- 302 Cory St
- 102 Vestal St
- 10 N Court St Unit 3
- 65 Bigelow St
- 397 Belmont St
- 407 Belmont St Unit 409
- 389 Belmont St
- 417 Belmont St
- 379 Belmont St
- 400 Belmont St
- 410 Belmont St
- 367 Belmont St
- 288 Underwood St
- 414 Belmont St
- 480 Pearce St Unit 482
- 559 President Ave
- 571 President Ave
- 380 Belmont St
- 274 Underwood St
- 581 President Ave
- 581 President Ave Unit 2
- 262 Underwood St
- 304 Underwood St
- 368 Belmont St Unit 3