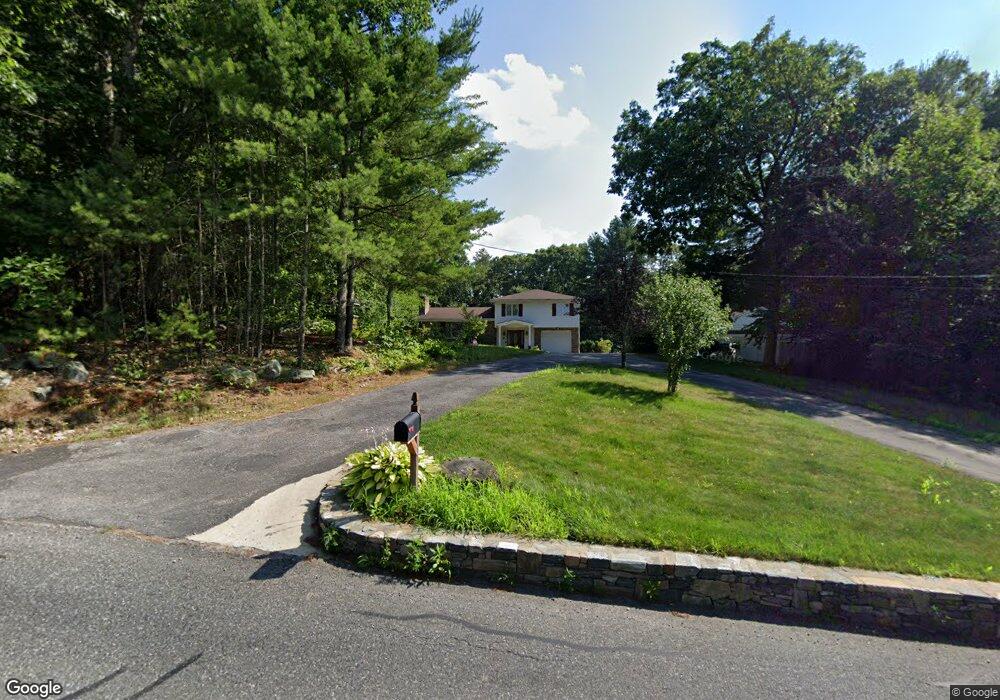
397 Central St Milford, MA 01757
Estimated Value: $551,000 - $748,000
3
Beds
2
Baths
1,960
Sq Ft
$340/Sq Ft
Est. Value
About This Home
This home is located at 397 Central St, Milford, MA 01757 and is currently estimated at $665,484, approximately $339 per square foot. 397 Central St is a home located in Worcester County with nearby schools including Milford High School and Bethany Christian Academy.
Ownership History
Date
Name
Owned For
Owner Type
Purchase Details
Closed on
May 23, 1996
Sold by
Muradian Joanne M
Bought by
Goncalves Jose J and Goncalves Maria
Current Estimated Value
Home Financials for this Owner
Home Financials are based on the most recent Mortgage that was taken out on this home.
Original Mortgage
$100,000
Outstanding Balance
$5,703
Interest Rate
8.01%
Mortgage Type
Purchase Money Mortgage
Estimated Equity
$659,781
Create a Home Valuation Report for This Property
The Home Valuation Report is an in-depth analysis detailing your home's value as well as a comparison with similar homes in the area
Home Values in the Area
Average Home Value in this Area
Purchase History
| Date | Buyer | Sale Price | Title Company |
|---|---|---|---|
| Goncalves Jose J | $186,500 | -- |
Source: Public Records
Mortgage History
| Date | Status | Borrower | Loan Amount |
|---|---|---|---|
| Open | Goncalves Jose J | $100,000 | |
| Previous Owner | Goncalves Jose J | $30,000 | |
| Previous Owner | Goncalves Jose J | $30,000 |
Source: Public Records
Tax History Compared to Growth
Tax History
| Year | Tax Paid | Tax Assessment Tax Assessment Total Assessment is a certain percentage of the fair market value that is determined by local assessors to be the total taxable value of land and additions on the property. | Land | Improvement |
|---|---|---|---|---|
| 2025 | $8,000 | $625,000 | $221,400 | $403,600 |
| 2024 | $7,930 | $596,700 | $212,700 | $384,000 |
| 2023 | $7,722 | $534,400 | $184,200 | $350,200 |
| 2022 | $7,438 | $483,300 | $168,900 | $314,400 |
| 2021 | $7,368 | $461,100 | $168,900 | $292,200 |
| 2020 | $7,153 | $448,200 | $168,900 | $279,300 |
| 2019 | $6,905 | $417,500 | $168,900 | $248,600 |
| 2018 | $6,566 | $396,500 | $164,600 | $231,900 |
| 2017 | $5,955 | $354,700 | $164,600 | $190,100 |
| 2016 | $6,094 | $354,700 | $164,600 | $190,100 |
| 2015 | $5,737 | $326,900 | $155,900 | $171,000 |
Source: Public Records
Map
Nearby Homes
- 11 Black Bear Unit 11
- 9 Black Bear Cir Unit 9
- 10 Black Bear Unit 10
- 7 Black Bear Unit 7
- 33 Brown Bear Ln Unit 33
- 43 Black Bear Cir Unit 43
- 3 Black Bear Cir Unit 3
- 48 Black Bear Cir Unit 48
- 23 Christina Rd
- 9 Hillside Ave
- 3 S Central St
- 97 E Street Extension
- 35 Woodland Ave Unit 35A
- 57 Beach St
- 17 Middleton St
- 30 Whitney St
- 55 Jefferson St
- 48 Claflin St
- 15 Free St
- 102-104 Central St
- 395 Central St
- 401 Central St
- 402 Central St
- 400 Central St
- 399 Central St
- 399 Central St
- 399 1/2 Central St
- 393 Central St
- 398 Central St
- 404 Central St
- 403 Central St
- 391 Central St
- 389 1/2 Central St
- 389 Central St
- 389 Central St Unit 1
- 389 Central St
- 406 Central St
- 69 Beaver St
- Lot 0 Beaver
- 71 Beaver St