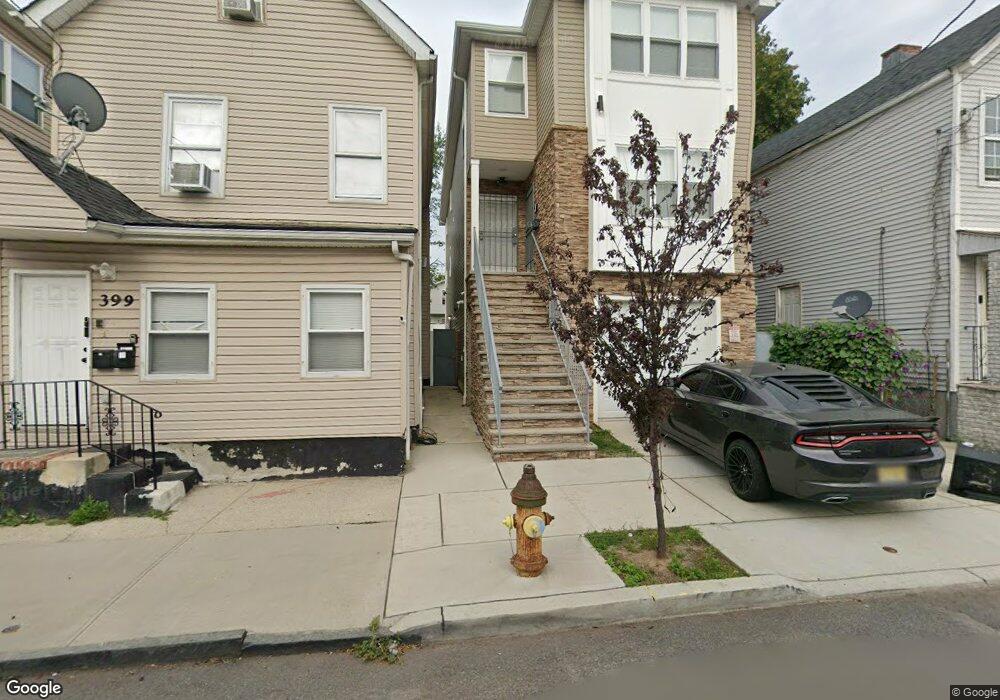
397 S 8th St Unit 2 Newark, NJ 07103
West Side NeighborhoodEstimated Value: $805,588
3
Beds
2
Baths
2,986
Sq Ft
$270/Sq Ft
Est. Value
About This Home
This home is located at 397 S 8th St Unit 2, Newark, NJ 07103 and is currently estimated at $805,588, approximately $269 per square foot. 397 S 8th St Unit 2 is a home located in Essex County with nearby schools including Harriet Tubman School, Camden Street Elementary School, and Cleveland Elementary School.
Ownership History
Date
Name
Owned For
Owner Type
Purchase Details
Closed on
Nov 20, 2023
Sold by
Carlos Lopes Investments Limited Liabili
Current Estimated Value
Home Financials for this Owner
Home Financials are based on the most recent Mortgage that was taken out on this home.
Original Mortgage
$726,596
Outstanding Balance
$714,090
Interest Rate
7.57%
Mortgage Type
FHA
Estimated Equity
$91,498
Purchase Details
Closed on
Dec 14, 2022
Sold by
City Of Newark
Bought by
Carlos Lopes Investments Llc
Purchase Details
Closed on
May 11, 1978
Bought by
City Of Newark
Create a Home Valuation Report for This Property
The Home Valuation Report is an in-depth analysis detailing your home's value as well as a comparison with similar homes in the area
Home Values in the Area
Average Home Value in this Area
Purchase History
| Date | Buyer | Sale Price | Title Company |
|---|---|---|---|
| -- | $740,000 | Fidelity National Title | |
| Carlos Lopes Investments Llc | $15,000 | -- | |
| City Of Newark | -- | -- |
Source: Public Records
Mortgage History
| Date | Status | Borrower | Loan Amount |
|---|---|---|---|
| Open | -- | $726,596 |
Source: Public Records
Tax History Compared to Growth
Tax History
| Year | Tax Paid | Tax Assessment Tax Assessment Total Assessment is a certain percentage of the fair market value that is determined by local assessors to be the total taxable value of land and additions on the property. | Land | Improvement |
|---|---|---|---|---|
| 2025 | $1,167 | $438,000 | $31,300 | $406,700 |
| 2024 | $1,167 | $438,000 | $31,300 | $406,700 |
| 2023 | $0 | $31,300 | $31,300 | $0 |
| 2022 | $0 | $31,300 | $31,300 | $0 |
| 2021 | $0 | $31,300 | $31,300 | $0 |
| 2020 | $0 | $31,300 | $31,300 | $0 |
| 2019 | $0 | $31,300 | $31,300 | $0 |
| 2018 | $0 | $31,300 | $31,300 | $0 |
| 2017 | $0 | $31,300 | $31,300 | $0 |
| 2016 | $0 | $31,300 | $31,300 | $0 |
| 2015 | -- | $31,300 | $31,300 | $0 |
| 2014 | -- | $31,300 | $31,300 | $0 |
Source: Public Records
Map
Nearby Homes