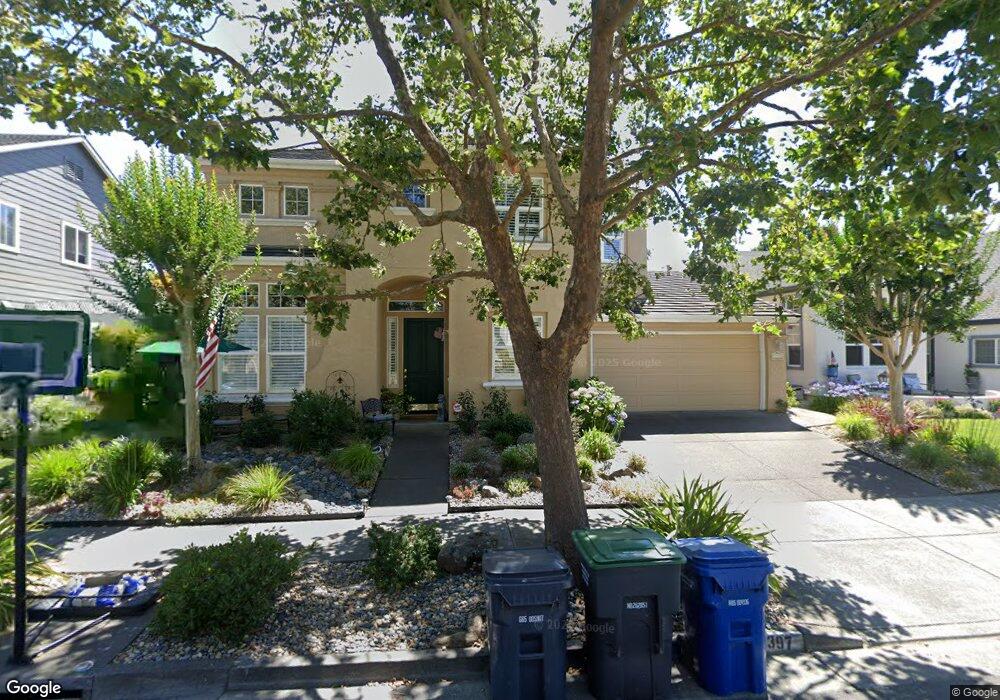
397 Sparrow Ln Petaluma, CA 94954
College Heights NeighborhoodEstimated Value: $1,109,332 - $1,253,000
3
Beds
3
Baths
2,407
Sq Ft
$494/Sq Ft
Est. Value
About This Home
This home is located at 397 Sparrow Ln, Petaluma, CA 94954 and is currently estimated at $1,189,333, approximately $494 per square foot. 397 Sparrow Ln is a home located in Sonoma County with nearby schools including Kenilworth Junior High School, Casa Grande High School, and Sonoma Mountain Elementary School.
Ownership History
Date
Name
Owned For
Owner Type
Purchase Details
Closed on
Mar 18, 2020
Sold by
Smith Thomas R and Smith Brita M
Bought by
Smith Thomas R and Smith Family Trust
Current Estimated Value
Purchase Details
Closed on
Nov 27, 2002
Sold by
Smith Thomas R and Smith Brita M
Bought by
Smith Thomas R and Smith Brita M
Home Financials for this Owner
Home Financials are based on the most recent Mortgage that was taken out on this home.
Original Mortgage
$236,000
Outstanding Balance
$101,665
Interest Rate
6.28%
Estimated Equity
$1,087,668
Purchase Details
Closed on
Mar 11, 1999
Sold by
Willow Glen Partners Llc
Bought by
Smith Thomas and Smith Brita M
Home Financials for this Owner
Home Financials are based on the most recent Mortgage that was taken out on this home.
Original Mortgage
$215,000
Interest Rate
6.73%
Create a Home Valuation Report for This Property
The Home Valuation Report is an in-depth analysis detailing your home's value as well as a comparison with similar homes in the area
Home Values in the Area
Average Home Value in this Area
Purchase History
| Date | Buyer | Sale Price | Title Company |
|---|---|---|---|
| Smith Thomas R | -- | None Available | |
| Smith Thomas R | -- | Old Republic Title Co | |
| Smith Thomas | $406,136 | Sonoma Title Guaranty Compan |
Source: Public Records
Mortgage History
| Date | Status | Borrower | Loan Amount |
|---|---|---|---|
| Open | Smith Thomas R | $236,000 | |
| Closed | Smith Thomas | $215,000 | |
| Closed | Smith Thomas R | $214,000 |
Source: Public Records
Tax History
| Year | Tax Paid | Tax Assessment Tax Assessment Total Assessment is a certain percentage of the fair market value that is determined by local assessors to be the total taxable value of land and additions on the property. | Land | Improvement |
|---|---|---|---|---|
| 2025 | $7,037 | $636,645 | $203,798 | $432,847 |
| 2024 | $7,037 | $624,162 | $199,802 | $424,360 |
| 2023 | $7,037 | $611,925 | $195,885 | $416,040 |
| 2022 | $6,870 | $599,928 | $192,045 | $407,883 |
| 2021 | $6,788 | $588,166 | $188,280 | $399,886 |
| 2020 | $6,832 | $582,136 | $186,350 | $395,786 |
| 2019 | $6,760 | $570,723 | $182,697 | $388,026 |
| 2018 | $6,565 | $559,533 | $179,115 | $380,418 |
| 2017 | $6,470 | $548,562 | $175,603 | $372,959 |
| 2016 | $6,275 | $537,807 | $172,160 | $365,647 |
| 2015 | $6,115 | $529,729 | $169,574 | $360,155 |
| 2014 | $6,053 | $519,354 | $166,253 | $353,101 |
Source: Public Records
Map
Nearby Homes
- 1811 Maiden Ln
- 1642 Lauren Dr
- 1713 Alhambra Ct
- 1717 Brompton St
- 1997 Rainier Cir
- 1321 Mcneil Ave
- 148 Oakwood Dr
- 97 Candlewood Dr
- 101 Arlington Dr
- 571 Birchwood Dr
- 75 Candlewood Dr
- 1313 Mcgregor Ave
- 1636 Caulfield Ln
- 11 Montclair Ct
- 125 Saratoga Ct
- 930 Martin Cir
- 800 Mckillop Ct
- 717 N Mcdowell Blvd Unit 511
- 2302 Marylyn Cir Unit 11
- 14 Sheffield Place
- 393 Sparrow Ln
- 401 Sparrow Ln
- 396 Song Bird Way
- 392 Song Bird Way
- 400 Song Bird Way
- 389 Sparrow Ln
- 405 Sparrow Ln
- 396 Sparrow Ln
- 392 Sparrow Ln
- 404 Song Bird Way
- 388 Song Bird Way
- 400 Sparrow Ln
- 388 Sparrow Ln
- 385 Sparrow Ln
- 404 Sparrow Ln
- 384 Song Bird Way
- 384 Sparrow Ln
- 1891 Mallard Ln
- 397 Song Bird Way
- 1895 Mallard Ln
Your Personal Tour Guide
Ask me questions while you tour the home.