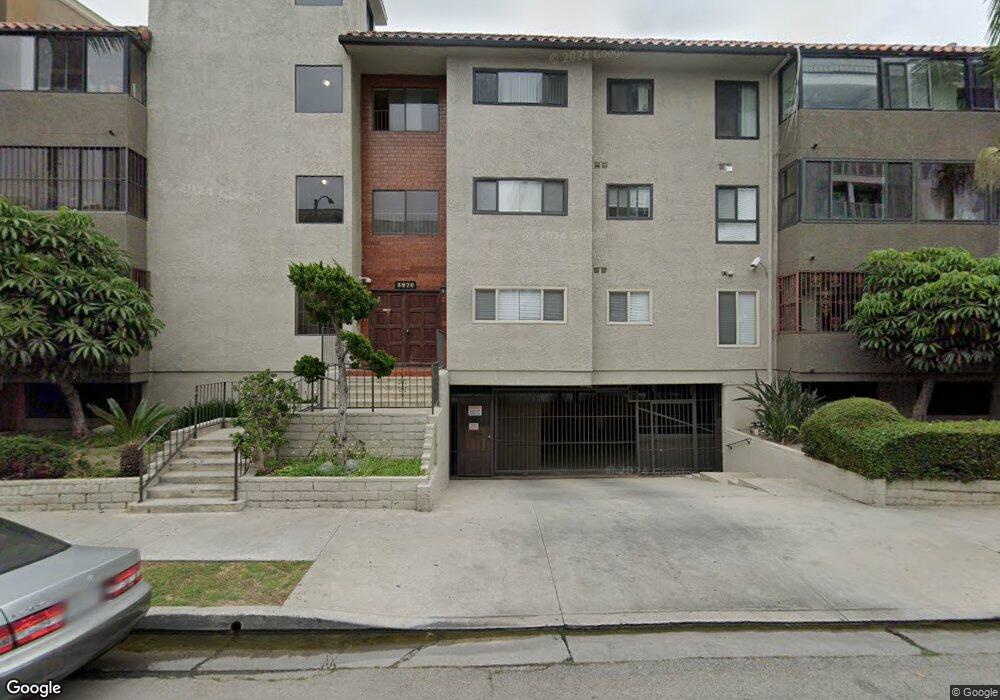
3970 Ingraham St Unit 201 Los Angeles, CA 90005
Koreatown NeighborhoodEstimated Value: $662,000 - $719,815
2
Beds
2
Baths
1,428
Sq Ft
$487/Sq Ft
Est. Value
About This Home
This home is located at 3970 Ingraham St Unit 201, Los Angeles, CA 90005 and is currently estimated at $695,954, approximately $487 per square foot. 3970 Ingraham St Unit 201 is a home located in Los Angeles County with nearby schools including Wilshire Park Elementary School, John Burroughs Middle School, and Los Angeles Senior High School.
Ownership History
Date
Name
Owned For
Owner Type
Purchase Details
Closed on
Nov 17, 2015
Sold by
Lee Cleo Yoon
Bought by
Lee Ju Bok and Lee Bok Cha
Current Estimated Value
Purchase Details
Closed on
Dec 27, 1996
Sold by
Kim Clara
Bought by
Lee Cleo Yoon
Home Financials for this Owner
Home Financials are based on the most recent Mortgage that was taken out on this home.
Original Mortgage
$116,000
Outstanding Balance
$12,347
Interest Rate
7.53%
Estimated Equity
$683,607
Purchase Details
Closed on
Sep 6, 1996
Sold by
Kim Sook Ja
Bought by
Kim Clark
Purchase Details
Closed on
Mar 7, 1996
Sold by
Kim Clara
Bought by
Kim Sook Ja
Purchase Details
Closed on
Oct 19, 1995
Sold by
Tse Lai Chung and Chow Wai
Bought by
Kim Clara
Home Financials for this Owner
Home Financials are based on the most recent Mortgage that was taken out on this home.
Original Mortgage
$112,500
Interest Rate
7.47%
Create a Home Valuation Report for This Property
The Home Valuation Report is an in-depth analysis detailing your home's value as well as a comparison with similar homes in the area
Home Values in the Area
Average Home Value in this Area
Purchase History
| Date | Buyer | Sale Price | Title Company |
|---|---|---|---|
| Lee Ju Bok | -- | None Available | |
| Lee Cleo Yoon | $145,000 | North American Title | |
| Kim Clark | -- | North American Title | |
| Kim Sook Ja | -- | -- | |
| Kim Clara | $125,000 | First American Title Co |
Source: Public Records
Mortgage History
| Date | Status | Borrower | Loan Amount |
|---|---|---|---|
| Open | Lee Cleo Yoon | $116,000 | |
| Previous Owner | Kim Clara | $112,500 |
Source: Public Records
Tax History Compared to Growth
Tax History
| Year | Tax Paid | Tax Assessment Tax Assessment Total Assessment is a certain percentage of the fair market value that is determined by local assessors to be the total taxable value of land and additions on the property. | Land | Improvement |
|---|---|---|---|---|
| 2025 | $2,857 | $236,126 | $111,388 | $124,738 |
| 2024 | $2,857 | $231,497 | $109,204 | $122,293 |
| 2023 | $2,806 | $226,959 | $107,063 | $119,896 |
| 2022 | $2,679 | $222,510 | $104,964 | $117,546 |
| 2021 | $2,635 | $218,148 | $102,906 | $115,242 |
| 2019 | $2,555 | $211,679 | $99,854 | $111,825 |
| 2018 | $2,533 | $207,530 | $97,897 | $109,633 |
| 2016 | $2,491 | $199,474 | $94,097 | $105,377 |
| 2015 | $2,455 | $196,479 | $92,684 | $103,795 |
| 2014 | $2,472 | $192,631 | $90,869 | $101,762 |
Source: Public Records
Map
Nearby Homes
- 811 S Wilton Place
- 820 S Wilton Place Unit 405
- 4085 W 7th St
- 3855 Ingraham St Unit 204
- 616 S Wilton Place Unit 103
- 695 S Norton Ave
- 733 S Manhattan Place Unit 401
- 733 S Manhattan Place Unit 405
- 691 S Norton Ave
- 4100 Wilshire Blvd Unit 303
- 738 S Norton Ave
- 620 S Gramercy Place Unit 239
- 620 S Gramercy Place Unit 412
- 676 S Bronson Ave
- 3810 Wilshire Blvd Unit 1108
- 3810 Wilshire Blvd Unit 1409
- 3810 Wilshire Blvd Unit 408
- 3810 Wilshire Blvd Unit 1506
- 3810 Wilshire Blvd Unit 1706
- 3810 Wilshire Blvd Unit 1711
- 3970 Ingraham St Unit 205
- 3970 Ingraham St Unit 204
- 3970 Ingraham St Unit 203
- 3970 Ingraham St Unit 202
- 3970 Ingraham St Unit 105
- 3970 Ingraham St Unit 104
- 3970 Ingraham St Unit 103
- 3970 Ingraham St Unit 102
- 3970 Ingraham St Unit 101
- 3970 Ingraham St Unit 305
- 3970 Ingraham St Unit 304
- 3970 Ingraham St Unit 303
- 3970 Ingraham St Unit 301
- 3980 Ingraham St
- 3960 Ingraham St
- 3960 Ingraham St Unit 502
- 3960 Ingraham St Unit 501
- 3960 Ingraham St Unit 402
- 3960 Ingraham St Unit 401
- 3960 Ingraham St Unit 302