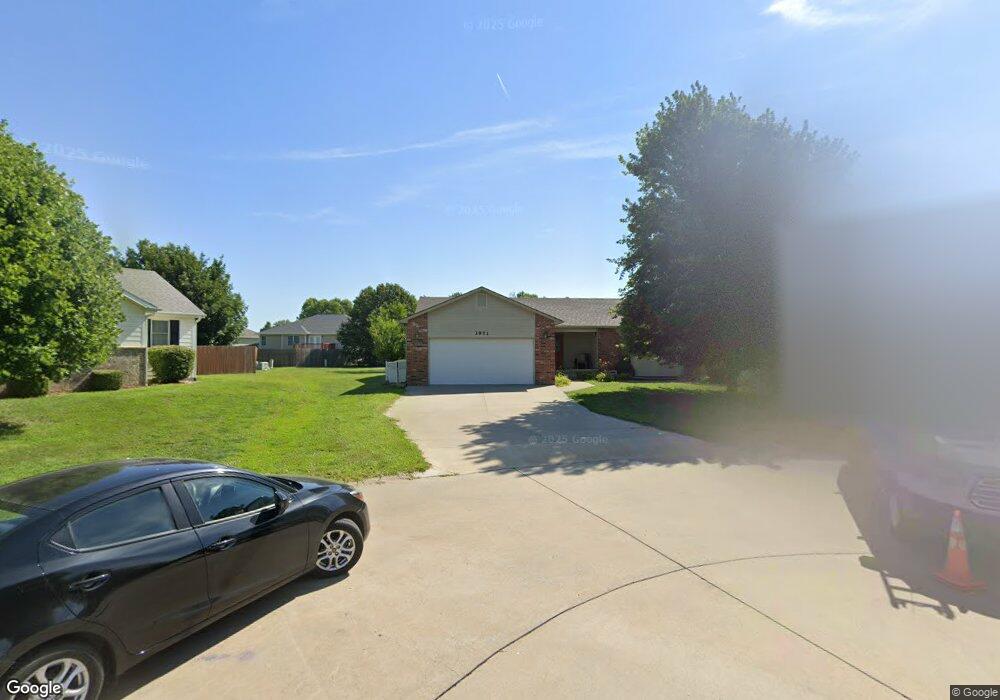
3971 Eagle Talon Cir Manhattan, KS 66502
Estimated Value: $327,000 - $367,000
4
Beds
2
Baths
2,880
Sq Ft
$121/Sq Ft
Est. Value
About This Home
This home is located at 3971 Eagle Talon Cir, Manhattan, KS 66502 and is currently estimated at $349,151, approximately $121 per square foot. 3971 Eagle Talon Cir is a home located in Pottawatomie County with nearby schools including Woodrow Wilson Elementary School, Dwight D. Eisenhower Middle School, and Manhattan High School.
Ownership History
Date
Name
Owned For
Owner Type
Purchase Details
Closed on
Jul 13, 2010
Sold by
Evans David A and Evans Sheelagh M
Bought by
Sanders James and Sanders James C
Current Estimated Value
Home Financials for this Owner
Home Financials are based on the most recent Mortgage that was taken out on this home.
Original Mortgage
$194,270
Outstanding Balance
$123,160
Interest Rate
3.82%
Mortgage Type
Adjustable Rate Mortgage/ARM
Estimated Equity
$225,991
Purchase Details
Closed on
Apr 15, 2008
Sold by
Turrentine Michael D and Turrentine Susan C
Bought by
Evans David A and Evans Sheelagh M
Home Financials for this Owner
Home Financials are based on the most recent Mortgage that was taken out on this home.
Original Mortgage
$188,100
Interest Rate
6.07%
Mortgage Type
New Conventional
Purchase Details
Closed on
May 16, 2005
Sold by
Weixelman Sean J and Weixelman Christine L
Bought by
Turrentine Michael D
Create a Home Valuation Report for This Property
The Home Valuation Report is an in-depth analysis detailing your home's value as well as a comparison with similar homes in the area
Home Values in the Area
Average Home Value in this Area
Purchase History
| Date | Buyer | Sale Price | Title Company |
|---|---|---|---|
| Sanders James | -- | None Available | |
| Evans David A | -- | None Available | |
| Turrentine Michael D | -- | None Available |
Source: Public Records
Mortgage History
| Date | Status | Borrower | Loan Amount |
|---|---|---|---|
| Open | Sanders James | $194,270 | |
| Previous Owner | Evans David A | $188,100 |
Source: Public Records
Tax History Compared to Growth
Tax History
| Year | Tax Paid | Tax Assessment Tax Assessment Total Assessment is a certain percentage of the fair market value that is determined by local assessors to be the total taxable value of land and additions on the property. | Land | Improvement |
|---|---|---|---|---|
| 2025 | $1,277 | $37,290 | $4,099 | $33,191 |
| 2024 | $48 | $36,945 | $4,142 | $32,803 |
| 2023 | $4,946 | $35,781 | $4,069 | $31,712 |
| 2022 | $4,196 | $31,387 | $3,994 | $27,393 |
| 2021 | $4,196 | $29,062 | $3,856 | $25,206 |
| 2020 | $4,196 | $28,888 | $3,856 | $25,032 |
| 2019 | $4,333 | $29,417 | $3,718 | $25,699 |
| 2018 | $4,289 | $29,387 | $3,361 | $26,026 |
| 2017 | $4,058 | $28,418 | $3,112 | $25,306 |
| 2016 | $3,928 | $27,223 | $2,783 | $24,440 |
| 2015 | -- | $26,784 | $3,019 | $23,765 |
| 2014 | -- | $26,290 | $3,094 | $23,196 |
Source: Public Records
Map
Nearby Homes
- 8601 Eagle's Landing Dr
- 8613 Eagles Landing Dr
- 3902 Golden Eagle Dr
- 4031 Bald Eagle Dr
- 0000 Tuttle Creek Blvd
- 4319 Aspen Dr
- 6100 Tumbleweed Terrace
- Sutton Plan at Nelson Ridge
- Scorpio Plan at Nelson Ridge
- Olivia Plan at Nelson Ridge
- Noah Plan at Nelson Ridge
- Nicholas Plan at Nelson Ridge
- Nadia Plan at Nelson Ridge
- Madeline Plan at Nelson Ridge
- Lucas Plan at Nelson Ridge
- Liam Plan at Nelson Ridge
- Kyler Plan at Nelson Ridge
- Lennon Plan at Nelson Ridge
- Kate Plan at Nelson Ridge
- Heidi Plan at Nelson Ridge
- 3967 Eagle Talon Cir
- 3975 Eagle Talon Cir
- 3940 Golden Eagle Dr
- 3936 Golden Eagle Dr
- 3944 Golden Eagle Dr
- 3979 Bald Eagle Dr
- 3963 Eagle Talon Cir
- 3930 Golden Eagle Dr
- 3948 Golden Eagle Dr
- 3983 Bald Eagle Dr
- 3916 Golden Eagle Dr
- 3922 Golden Eagle Dr
- 3912 Golden Eagle Dr
- 3974 Bald Eagle Dr
- 3970 Bald Eagle Dr
- 3941 Golden Eagle Dr
- 3937 Golden Eagle Dr
- 3966 Bald Eagle Dr
- 8606 Eagles Landing Dr
- 3980 Bald Eagle Dr