Estimated Value: $619,936 - $696,000
3
Beds
3
Baths
2,960
Sq Ft
$226/Sq Ft
Est. Value
About This Home
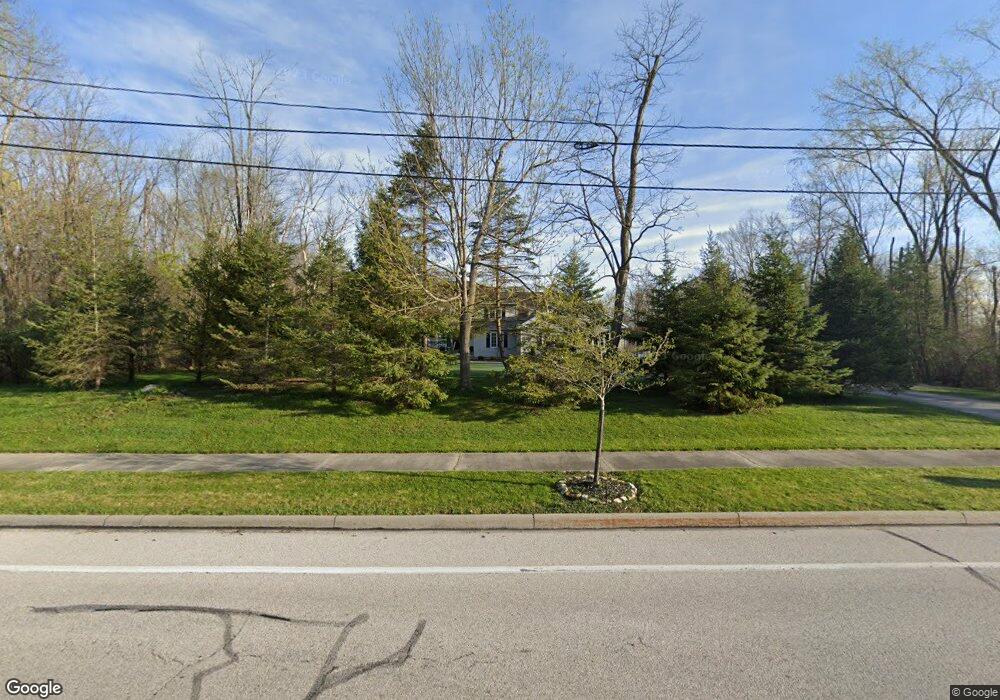
This home is located at 39715 Bainbridge Rd, Solon, OH 44139 and is currently estimated at $668,484, approximately $225 per square foot. 39715 Bainbridge Rd is a home located in Cuyahoga County with nearby schools including Orchard Middle School, Parkside Elementary School, and Solon Middle School.
Ownership History
Date
Name
Owned For
Owner Type
Purchase Details
Closed on
Apr 26, 2021
Sold by
Manocchio Tony and Tony Manocchio Revocable Trust
Bought by
Bzdafka Todd and Bzdafka Kristi
Current Estimated Value
Home Financials for this Owner
Home Financials are based on the most recent Mortgage that was taken out on this home.
Original Mortgage
$388,000
Interest Rate
3.1%
Mortgage Type
New Conventional
Purchase Details
Closed on
Dec 27, 2014
Sold by
Manocchio Tony and Manocchio Lisa
Bought by
Manocchio Tony and Tony Manocchio Revocable Trust
Purchase Details
Closed on
Jun 3, 2005
Sold by
Manocchio Tony and Manocchio Jacquelyn
Bought by
Manocchio Tony and Manocchio Jacquelyn
Purchase Details
Closed on
Jun 15, 1993
Sold by
Manocchio William T
Bought by
Manocchio Tony
Purchase Details
Closed on
Jan 1, 1991
Bought by
Manocchio William T
Create a Home Valuation Report for This Property
The Home Valuation Report is an in-depth analysis detailing your home's value as well as a comparison with similar homes in the area
Home Values in the Area
Average Home Value in this Area
Purchase History
| Date | Buyer | Sale Price | Title Company |
|---|---|---|---|
| Bzdafka Todd | $485,000 | American Title | |
| Manocchio Tony | -- | Attorney | |
| Manocchio Tony | -- | -- | |
| Manocchio Tony | -- | -- | |
| Manocchio William T | -- | -- |
Source: Public Records
Mortgage History
| Date | Status | Borrower | Loan Amount |
|---|---|---|---|
| Previous Owner | Bzdafka Todd | $388,000 |
Source: Public Records
Tax History Compared to Growth
Tax History
| Year | Tax Paid | Tax Assessment Tax Assessment Total Assessment is a certain percentage of the fair market value that is determined by local assessors to be the total taxable value of land and additions on the property. | Land | Improvement |
|---|---|---|---|---|
| 2024 | $9,336 | $169,750 | $53,235 | $116,515 |
| 2023 | $10,261 | $152,890 | $28,600 | $124,290 |
| 2022 | $10,239 | $152,880 | $28,595 | $124,285 |
| 2021 | $10,124 | $152,880 | $28,600 | $124,290 |
| 2020 | $9,379 | $129,540 | $24,220 | $105,320 |
| 2019 | $9,084 | $370,100 | $69,200 | $300,900 |
| 2018 | $4,068 | $129,540 | $24,220 | $105,320 |
| 2017 | $8,294 | $124,920 | $18,870 | $106,050 |
| 2016 | $8,216 | $124,920 | $18,870 | $106,050 |
| 2015 | $7,889 | $124,920 | $18,870 | $106,050 |
| 2014 | $7,889 | $115,680 | $17,470 | $98,210 |
Source: Public Records
Map
Nearby Homes
- 39780 Alsace Ct
- 7101 Bramshill Cir
- 18100 Hawksmoor Way
- 17581 Gates Landing Dr
- 7350 Edwards Landing
- 0 Glasgow Ln
- 36767 Meadowdale Dr
- 38280 Fox Run Dr
- 7090 Country Ln
- 36265 Timberlane Dr
- 17860 Northwood Lakes Dr Unit 3
- VL Aurora Rd
- 7754 Bainbridge Rd
- 17496 Lakesedge Trail
- 6454 Huntington Dr
- 65 Quail Ridge Dr
- 35906 Solon Rd
- 38450 Pettibone Rd
- 35891 Solon Rd
- 36015 Spatterdock Ln
- 16 S/L Dorset Ln
- 17 S/L Dorset Ln
- 39865 Bainbridge Rd
- 39565 Bainbridge Rd
- 6400 Dorset Ln
- 39890 Alsace Ct
- 39880 Alsace Ct
- 39900 Alsace Ct
- 39975 Bainbridge Rd
- 39385 Cortina Cir
- 39870 Alsace Ct
- 39425 Cortina Cir
- 6408 Dorset Ln
- 39415 Bainbridge Rd
- 39860 Alsace Ct
- 39345 Cortina Cir
- 39700 Alsace Ct
- 39850 Alsace Ct
- 6418 Dorset Ln
- 39839 Alsace Ct