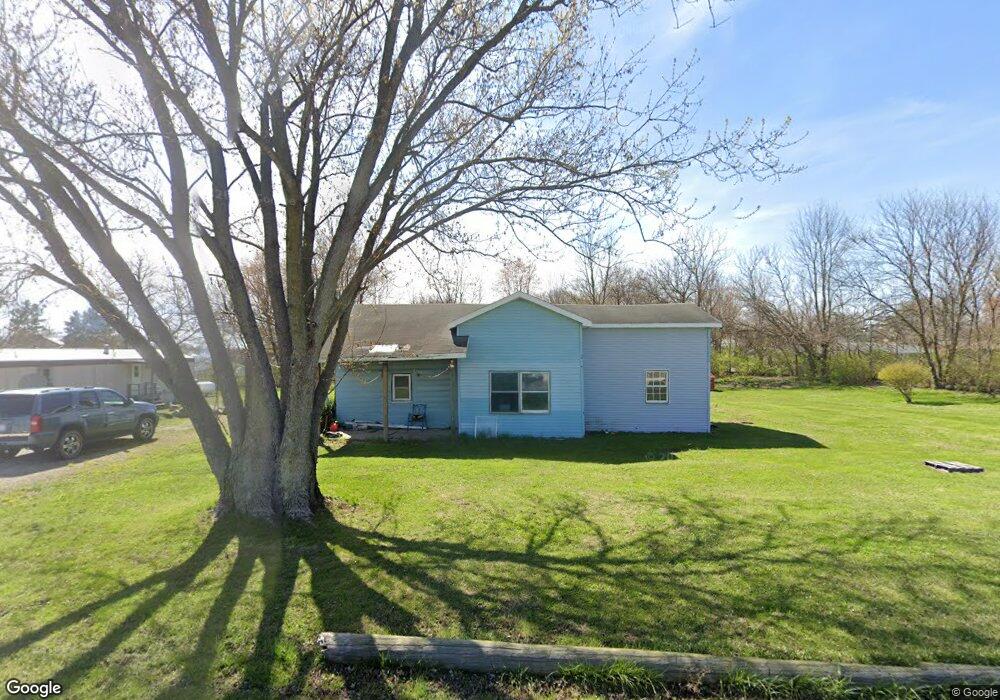
3973 N 600 E van Buren, IN 46991
Estimated Value: $94,000 - $114,000
2
Beds
1
Bath
1,360
Sq Ft
$77/Sq Ft
Est. Value
About This Home
This home is located at 3973 N 600 E, van Buren, IN 46991 and is currently estimated at $104,633, approximately $76 per square foot. 3973 N 600 E is a home located in Grant County.
Ownership History
Date
Name
Owned For
Owner Type
Purchase Details
Closed on
Nov 23, 2022
Sold by
Walters John T
Bought by
Toy Chelsea L
Current Estimated Value
Purchase Details
Closed on
Aug 18, 2021
Sold by
Bostic Nila J
Bought by
Walters John T
Purchase Details
Closed on
Mar 15, 2013
Sold by
Flanigan Tony R
Bought by
Flanigan Nsynila J and Young Nila J
Purchase Details
Closed on
Jun 2, 2006
Sold by
Young Nila J and Flanigan Nila J
Bought by
Flanigan Tony R and Flanigan Nila J
Home Financials for this Owner
Home Financials are based on the most recent Mortgage that was taken out on this home.
Original Mortgage
$28,500
Interest Rate
6.68%
Mortgage Type
New Conventional
Create a Home Valuation Report for This Property
The Home Valuation Report is an in-depth analysis detailing your home's value as well as a comparison with similar homes in the area
Purchase History
| Date | Buyer | Sale Price | Title Company |
|---|---|---|---|
| Toy Chelsea L | -- | -- | |
| Walters John T | $30,000 | None Available | |
| Flanigan Nsynila J | -- | None Available | |
| Flanigan Tony R | -- | None Available |
Source: Public Records
Mortgage History
| Date | Status | Borrower | Loan Amount |
|---|---|---|---|
| Previous Owner | Flanigan Tony R | $28,500 |
Source: Public Records
Tax History
| Year | Tax Paid | Tax Assessment Tax Assessment Total Assessment is a certain percentage of the fair market value that is determined by local assessors to be the total taxable value of land and additions on the property. | Land | Improvement |
|---|---|---|---|---|
| 2025 | $423 | $72,100 | $23,100 | $49,000 |
| 2024 | $423 | $75,500 | $23,100 | $52,400 |
| 2023 | $202 | $59,900 | $23,100 | $36,800 |
| 2022 | $914 | $80,100 | $19,400 | $60,700 |
| 2021 | $983 | $69,400 | $19,400 | $50,000 |
| 2020 | $887 | $67,100 | $19,400 | $47,700 |
| 2019 | $821 | $64,800 | $19,400 | $45,400 |
| 2018 | $739 | $59,600 | $19,400 | $40,200 |
| 2017 | $705 | $56,500 | $19,400 | $37,100 |
| 2016 | $553 | $56,500 | $19,400 | $37,100 |
| 2014 | $497 | $55,300 | $19,900 | $35,400 |
| 2013 | $497 | $55,200 | $19,900 | $35,300 |
Source: Public Records
Map
Nearby Homes
- 4015 N 600 E
- 2804 N 800 E
- 603 W Main St
- 8885 E 400 N
- 201 E Vine St
- 4420 E 100 N
- 402 N 600 E
- 9964 E 400 N
- I 69 E 700 N
- 933 E Bocock Rd
- 619 S 600 E
- 3220 N Huntington Rd
- 3105 N Huntington Rd
- 1700 E Bradford Pike
- 8219 E 100 S
- 2325 N Huntington Rd
- 2220 N Huntington Rd
- 703 E Bond Ave
- 1270 S 600 E
- 1113 E Grant St
Your Personal Tour Guide
Ask me questions while you tour the home.