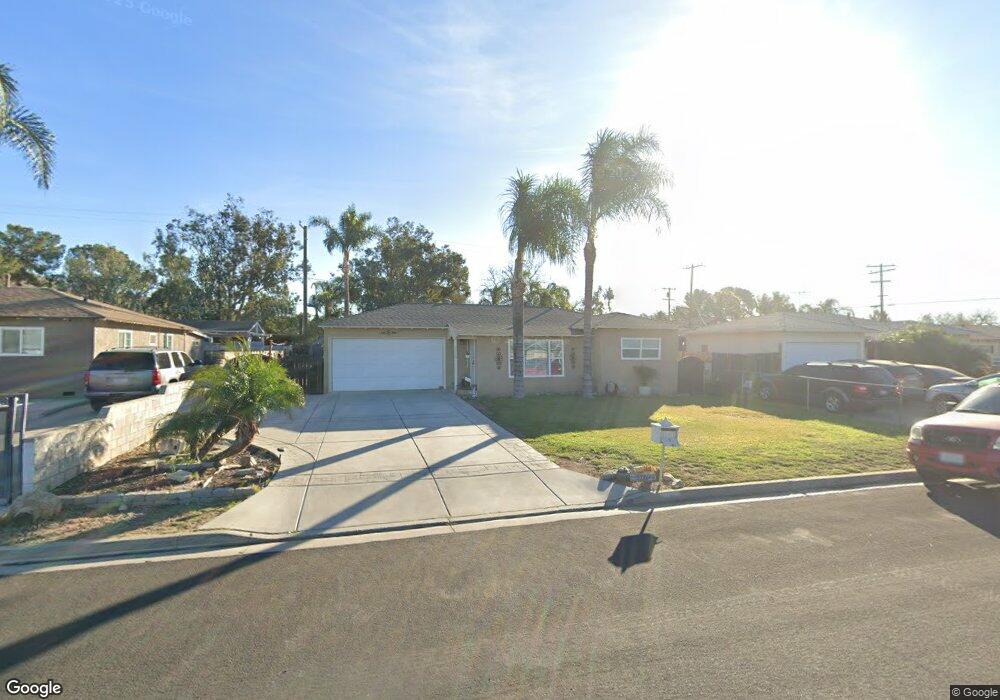
3976 Stanton St Riverside, CA 92509
Glen Avon NeighborhoodEstimated Value: $407,000 - $443,000
2
Beds
1
Bath
778
Sq Ft
$543/Sq Ft
Est. Value
About This Home
This home is located at 3976 Stanton St, Riverside, CA 92509 and is currently estimated at $422,485, approximately $543 per square foot. 3976 Stanton St is a home located in Riverside County with nearby schools including Mission Bell Elementary School, Jurupa Middle School, and Patriot High School.
Ownership History
Date
Name
Owned For
Owner Type
Purchase Details
Closed on
May 5, 2007
Sold by
Estrada Jorge
Bought by
Estrada Jorge and Estrada Yvonne
Current Estimated Value
Home Financials for this Owner
Home Financials are based on the most recent Mortgage that was taken out on this home.
Original Mortgage
$74,000
Outstanding Balance
$44,938
Interest Rate
6.14%
Mortgage Type
Stand Alone Refi Refinance Of Original Loan
Estimated Equity
$377,547
Purchase Details
Closed on
Oct 13, 1995
Sold by
Hud
Bought by
Estrada Jorge
Home Financials for this Owner
Home Financials are based on the most recent Mortgage that was taken out on this home.
Original Mortgage
$68,712
Interest Rate
7.59%
Mortgage Type
FHA
Purchase Details
Closed on
Mar 2, 1995
Sold by
Weitzeil John O and Weitzeil Sandra L
Bought by
Source One Mtg Services Corp
Purchase Details
Closed on
Jun 11, 1994
Sold by
Weitzeil John O
Bought by
Weitzeil Sandy L
Create a Home Valuation Report for This Property
The Home Valuation Report is an in-depth analysis detailing your home's value as well as a comparison with similar homes in the area
Home Values in the Area
Average Home Value in this Area
Purchase History
| Date | Buyer | Sale Price | Title Company |
|---|---|---|---|
| Estrada Jorge | -- | Lenders Choice Title Company | |
| Estrada Jorge | $35,000 | Quality Title Company | |
| Source One Mtg Services Corp | $63,302 | First Southwestern Title Co | |
| Hud | -- | First Southwestern Title Co | |
| Weitzeil Sandy L | -- | -- |
Source: Public Records
Mortgage History
| Date | Status | Borrower | Loan Amount |
|---|---|---|---|
| Open | Estrada Jorge | $74,000 | |
| Closed | Estrada Jorge | $68,712 |
Source: Public Records
Tax History
| Year | Tax Paid | Tax Assessment Tax Assessment Total Assessment is a certain percentage of the fair market value that is determined by local assessors to be the total taxable value of land and additions on the property. | Land | Improvement |
|---|---|---|---|---|
| 2025 | $1,843 | $116,244 | $49,817 | $66,427 |
| 2023 | $1,843 | $111,733 | $47,884 | $63,849 |
| 2022 | $1,415 | $109,544 | $46,946 | $62,598 |
| 2021 | $1,469 | $107,397 | $46,026 | $61,371 |
| 2020 | $1,343 | $106,297 | $45,555 | $60,742 |
| 2019 | $1,607 | $104,213 | $44,662 | $59,551 |
| 2018 | $1,563 | $102,171 | $43,788 | $58,383 |
| 2017 | $1,548 | $100,169 | $42,930 | $57,239 |
| 2016 | $1,463 | $98,206 | $42,089 | $56,117 |
| 2015 | $1,508 | $96,732 | $41,457 | $55,275 |
| 2014 | $1,398 | $94,840 | $40,646 | $54,194 |
Source: Public Records
Map
Nearby Homes
- 9468 Hastings Blvd
- 0 Fox Tail Ln
- 9085 Bellegrave Ave
- 3604 Campbell St
- 4041 Pedley Rd
- 4041 Pedley Rd Unit 74
- 9885 Mission Blvd
- 4080 Pedley Rd Unit 2
- 4080 Pedley Rd Unit 189
- 4080 Pedley Rd Unit 155
- 4080 Pedley Rd Unit 211
- 4080 Pedley Rd Unit 139
- 9861 Mission Blvd Unit 14
- 4080
- 4080
- 10025 Mission Blvd
- 4176 Agate St
- 9931 Union St
- 4713 Shetland Ln
- 4856 Poinsetta Place
- 3966 Stanton St
- 3986 Stanton St
- 3956 Stanton St
- 3994 Stanton St
- 9309 Hastings Blvd
- 3975 Stanton St
- 3965 Stanton St
- 3985 Stanton St
- 3946 Stanton St
- 3955 Stanton St
- 3995 Stanton St
- 3936 Stanton St
- 3945 Stanton St
- 9361 Hastings Blvd
- 3935 Stanton St
- 9310 Hastings Blvd
- 3926 Stanton St
- 9285 Hastings Blvd
- 9338 Hastings Blvd
- 3925 Stanton St
Your Personal Tour Guide
Ask me questions while you tour the home.