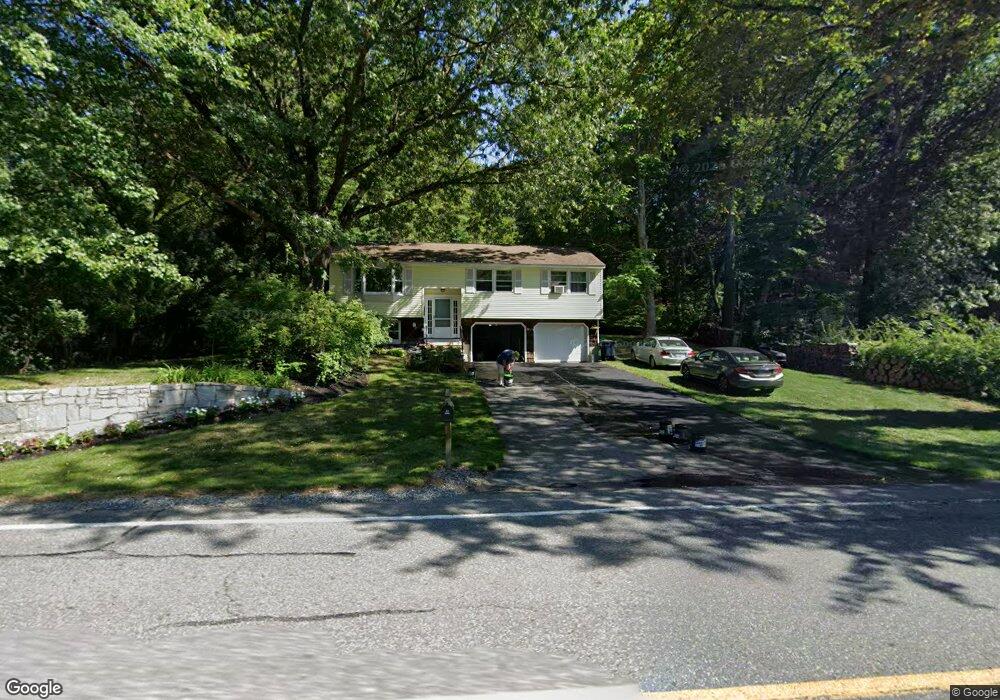
398 Main Dunstable Rd Nashua, NH 03062
Southwest Nashua NeighborhoodEstimated Value: $505,754 - $526,000
3
Beds
2
Baths
1,132
Sq Ft
$454/Sq Ft
Est. Value
About This Home
This home is located at 398 Main Dunstable Rd, Nashua, NH 03062 and is currently estimated at $513,439, approximately $453 per square foot. 398 Main Dunstable Rd is a home located in Hillsborough County with nearby schools including Main Dunstable School, Elm Street Middle School, and Nashua High School South.
Ownership History
Date
Name
Owned For
Owner Type
Purchase Details
Closed on
Sep 26, 1997
Sold by
Williams Mary A
Bought by
Johnson Mark T
Current Estimated Value
Home Financials for this Owner
Home Financials are based on the most recent Mortgage that was taken out on this home.
Original Mortgage
$116,922
Interest Rate
7.47%
Mortgage Type
Purchase Money Mortgage
Create a Home Valuation Report for This Property
The Home Valuation Report is an in-depth analysis detailing your home's value as well as a comparison with similar homes in the area
Home Values in the Area
Average Home Value in this Area
Purchase History
| Date | Buyer | Sale Price | Title Company |
|---|---|---|---|
| Johnson Mark T | $117,500 | -- |
Source: Public Records
Mortgage History
| Date | Status | Borrower | Loan Amount |
|---|---|---|---|
| Open | Johnson Mark T | $142,157 | |
| Closed | Johnson Mark T | $151,650 | |
| Closed | Johnson Mark T | $116,922 |
Source: Public Records
Tax History Compared to Growth
Tax History
| Year | Tax Paid | Tax Assessment Tax Assessment Total Assessment is a certain percentage of the fair market value that is determined by local assessors to be the total taxable value of land and additions on the property. | Land | Improvement |
|---|---|---|---|---|
| 2024 | $7,368 | $463,400 | $168,200 | $295,200 |
| 2023 | $7,006 | $384,300 | $134,500 | $249,800 |
| 2022 | $6,944 | $384,300 | $134,500 | $249,800 |
| 2021 | $6,132 | $264,100 | $89,700 | $174,400 |
| 2020 | $5,971 | $264,100 | $89,700 | $174,400 |
| 2019 | $5,747 | $264,100 | $89,700 | $174,400 |
| 2018 | $5,602 | $264,100 | $89,700 | $174,400 |
| 2017 | $5,083 | $197,100 | $78,000 | $119,100 |
| 2016 | $4,941 | $197,100 | $78,000 | $119,100 |
| 2015 | $4,835 | $197,100 | $78,000 | $119,100 |
| 2014 | $4,740 | $197,100 | $78,000 | $119,100 |
Source: Public Records
Map
Nearby Homes
- 2 Rene Dr
- 424 Main Dunstable Rd
- 7 Roderick Cir
- 25 Cortez Dr Unit U57
- 5 Wilderness Dr
- 24 Yarmouth Dr
- 22 Newburgh Rd
- 42 Woodfield St
- 4 Henry David Dr Unit 203
- 5 Iris Ct Unit U147
- 130 Searles Rd
- 3 Pluto Ln
- 47 Dogwood Dr Unit U202
- 12 Spring Cove Rd Unit U103
- 23 Glen Dr
- 40 Spring Cove Rd Unit U117
- 31 Spring Cove Rd Unit U148
- 4 Chesapeake Rd
- 33 Cannon Dr
- 500 Candlewood Park Unit 21
- 396 Main Dunstable Rd
- 402 Main Dunstable Rd
- 404 Main Dunstable Rd
- 30 Sagamore Rd
- 28 Sagamore Rd
- 406 Main Dunstable Rd
- 26 Sagamore Rd
- 390 Main Dunstable Rd
- 405 Main Dunstable Rd
- 407 Main Dunstable Rd
- 27 Sagamore Rd
- 35 Macdonald Dr
- 33 Macdonald Dr
- 37 Macdonald Dr
- 31 Macdonald Dr
- 24 Sagamore Rd
- 388 Main Dunstable Rd
- 408 Main Dunstable Rd
- 27 Macdonald Dr
- 9 Michael Ave