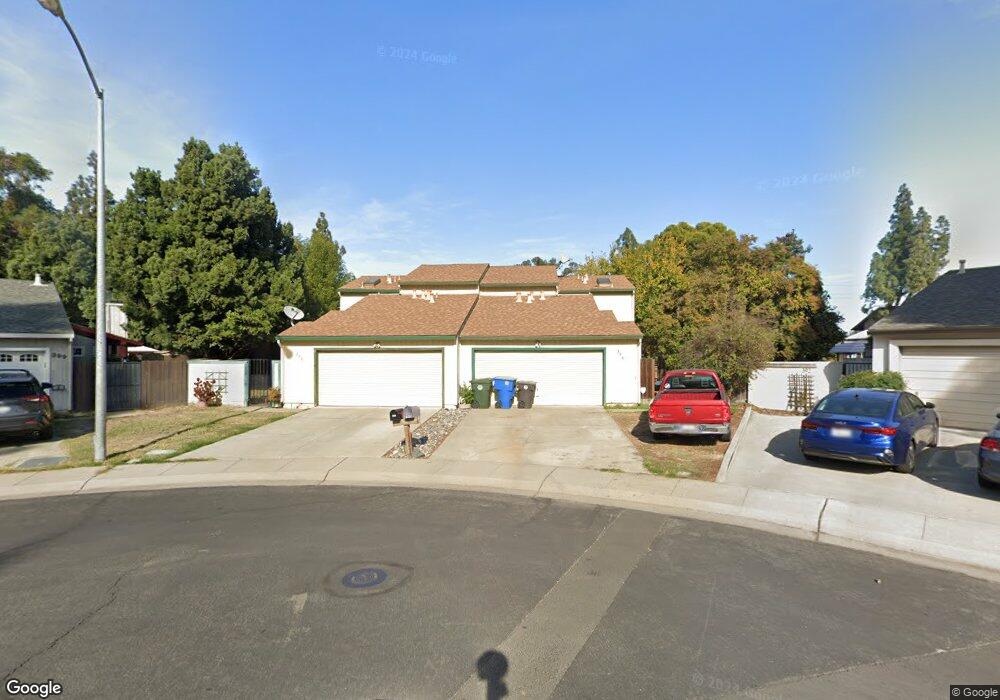
398 Scenic Place Manteca, CA 95337
Downtown Manteca NeighborhoodEstimated Value: $354,000 - $444,000
2
Beds
3
Baths
1,388
Sq Ft
$295/Sq Ft
Est. Value
About This Home
This home is located at 398 Scenic Place, Manteca, CA 95337 and is currently estimated at $408,940, approximately $294 per square foot. 398 Scenic Place is a home located in San Joaquin County with nearby schools including Stella Brockman Elementary School and Manteca High School.
Ownership History
Date
Name
Owned For
Owner Type
Purchase Details
Closed on
May 6, 2014
Sold by
Teicheira James L
Bought by
Teicheira James L and Teicheira 2014 Revocable Trust
Current Estimated Value
Purchase Details
Closed on
Jan 6, 2014
Sold by
Clausen Angelina and Teicheira James L
Bought by
Clausen Angelina and Teicheira James L
Purchase Details
Closed on
Apr 21, 1994
Sold by
Clausen William and Clausen Angelina
Bought by
Teicheira James L
Create a Home Valuation Report for This Property
The Home Valuation Report is an in-depth analysis detailing your home's value as well as a comparison with similar homes in the area
Home Values in the Area
Average Home Value in this Area
Purchase History
We collect this data history from publicly available records. To have your information removed, we recommend requesting removal directly through your county’s website.
| Date | Buyer | Sale Price | Title Company |
|---|---|---|---|
| Teicheira James L | -- | None Available | |
| Clausen Angelina | -- | None Available | |
| Teicheira James L | -- | -- |
Source: Public Records
Tax History
| Year | Tax Paid | Tax Assessment Tax Assessment Total Assessment is a certain percentage of the fair market value that is determined by local assessors to be the total taxable value of land and additions on the property. | Land | Improvement |
|---|---|---|---|---|
| 2025 | $1,717 | $153,291 | $69,678 | $83,613 |
| 2024 | $1,670 | $150,286 | $68,312 | $81,974 |
| 2023 | $1,649 | $147,340 | $66,973 | $80,367 |
| 2022 | $1,625 | $144,452 | $65,660 | $78,792 |
| 2021 | $1,607 | $141,621 | $64,373 | $77,248 |
| 2020 | $1,543 | $140,169 | $63,713 | $76,456 |
| 2019 | $1,523 | $137,421 | $62,464 | $74,957 |
| 2018 | $1,503 | $134,728 | $61,240 | $73,488 |
| 2017 | $1,481 | $132,088 | $60,040 | $72,048 |
| 2016 | $1,445 | $129,499 | $58,863 | $70,636 |
| 2014 | $1,345 | $125,056 | $56,844 | $68,212 |
Source: Public Records
Map
Nearby Homes
- 426 Cherry Ln Unit H
- 480 Cherry Ln Unit C
- 480 Cherry Ln Unit E
- 495 Cherry Ln Unit B
- 495 Cherry Ln Unit J
- 414 Cherry Ln Unit G
- 452 Benjamin Place
- 445 N Walnut Ave
- 419 Pioneer Ave
- 822 Buchanon Ln
- 1133 Topaz Dr
- 846 Del Monte Ct
- 224 El Capitan Ave
- 821 Nevada St
- 1427 Snyder St
- 516 Acacia Ave
- 1205 Camden Place
- 343 Poplar Ave
- 544 Lode St
- 1048 Aspen Dr
- 455 Cherry Ln Unit H
- 455 Cherry Ln Unit A
- 455 Cherry Ln Unit I
- 455 Cherry Ln Unit G
- 455 Cherry Ln Unit E
- 455 Cherry Ln Unit F
- 455 Cherry Ln Unit 30
- 455 Cherry Ln Unit 29
- 455 Cherry Ln Unit B
- 455 Cherry Ln Unit 36
- 455 Cherry Ln
- 455 Cherry Ln Unit 37
- 455 Cherry Ln Unit J
- 455 Cherry Ln Unit L
- 455 Cherry Ln Unit D
- 455 Cherry Ln Unit 34
- 439 Cherry Ln Unit A
- 439 Cherry Ln
- 439 Cherry Ln Unit E
- 439 Cherry Ln Unit 47
Your Personal Tour Guide
Ask me questions while you tour the home.