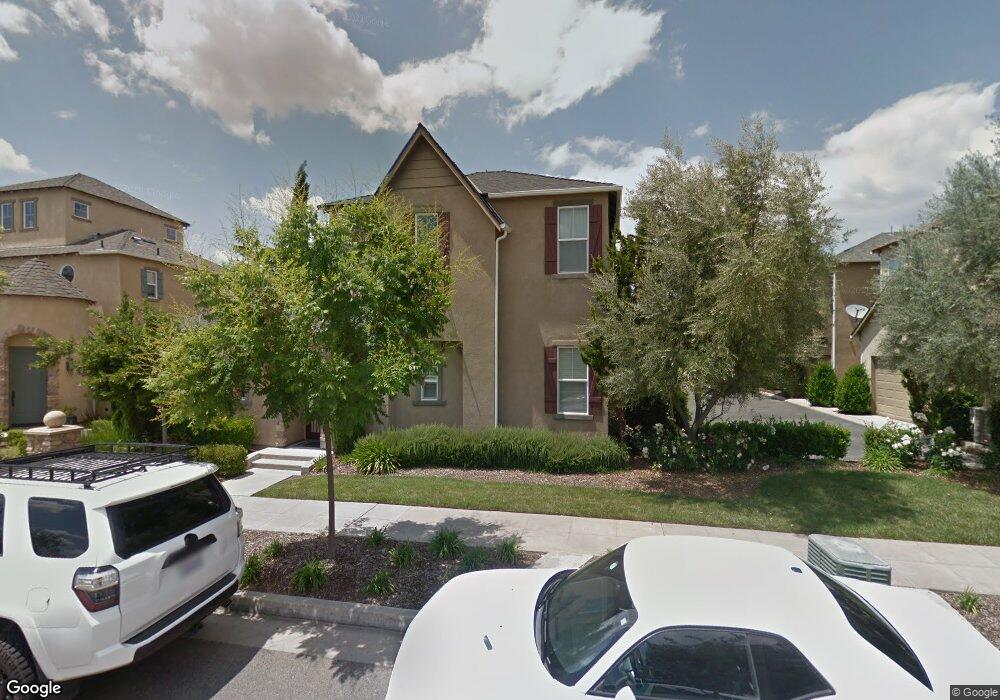
3983 Harlan Ranch Blvd Clovis, CA 93619
Estimated Value: $412,227 - $424,000
3
Beds
3
Baths
1,466
Sq Ft
$285/Sq Ft
Est. Value
About This Home
This home is located at 3983 Harlan Ranch Blvd, Clovis, CA 93619 and is currently estimated at $418,409, approximately $285 per square foot. 3983 Harlan Ranch Blvd is a home located in Fresno County with nearby schools including Bud Rank Elementary School, Granite Ridge Intermediate School, and Clovis North High School.
Ownership History
Date
Name
Owned For
Owner Type
Purchase Details
Closed on
Oct 14, 2015
Sold by
Fannie Mae
Bought by
Paxton Abigail
Current Estimated Value
Home Financials for this Owner
Home Financials are based on the most recent Mortgage that was taken out on this home.
Original Mortgage
$178,620
Outstanding Balance
$140,441
Interest Rate
3.86%
Mortgage Type
New Conventional
Estimated Equity
$277,968
Purchase Details
Closed on
May 27, 2015
Sold by
Marquez Pierre Andrew D and Marquez Cynthia E
Bought by
Federal National Mortgage Association
Purchase Details
Closed on
Aug 21, 2007
Sold by
Capri Court At Harlan Ranch Ii Lp
Bought by
Marquez Pierre Andrew D and Marquez Cynthia E
Home Financials for this Owner
Home Financials are based on the most recent Mortgage that was taken out on this home.
Original Mortgage
$293,210
Interest Rate
6.26%
Mortgage Type
Purchase Money Mortgage
Purchase Details
Closed on
Apr 16, 2007
Sold by
Cvec Group Inc
Bought by
Capri Court At Harlan Ranch Ii Lp
Create a Home Valuation Report for This Property
The Home Valuation Report is an in-depth analysis detailing your home's value as well as a comparison with similar homes in the area
Home Values in the Area
Average Home Value in this Area
Purchase History
| Date | Buyer | Sale Price | Title Company |
|---|---|---|---|
| Paxton Abigail | $223,500 | Servicelink | |
| Federal National Mortgage Association | $216,768 | Title365 | |
| Marquez Pierre Andrew D | $293,500 | Chicago Title Company | |
| Capri Court At Harlan Ranch Ii Lp | -- | Chicago Title Company |
Source: Public Records
Mortgage History
| Date | Status | Borrower | Loan Amount |
|---|---|---|---|
| Open | Paxton Abigail | $178,620 | |
| Previous Owner | Marquez Pierre Andrew D | $293,210 | |
| Closed | Capri Court At Harlan Ranch Ii Lp | $0 |
Source: Public Records
Tax History
| Year | Tax Paid | Tax Assessment Tax Assessment Total Assessment is a certain percentage of the fair market value that is determined by local assessors to be the total taxable value of land and additions on the property. | Land | Improvement |
|---|---|---|---|---|
| 2025 | $3,531 | $264,217 | $76,943 | $187,274 |
| 2023 | $3,390 | $253,958 | $73,956 | $180,002 |
| 2022 | $3,340 | $248,979 | $72,506 | $176,473 |
| 2021 | $3,229 | $244,098 | $71,085 | $173,013 |
| 2020 | $3,212 | $241,596 | $70,357 | $171,239 |
| 2019 | $3,152 | $236,860 | $68,978 | $167,882 |
| 2018 | $3,084 | $232,217 | $67,626 | $164,591 |
| 2017 | $3,030 | $227,664 | $66,300 | $161,364 |
| 2016 | $2,932 | $223,200 | $65,000 | $158,200 |
| 2015 | $3,098 | $245,200 | $81,700 | $163,500 |
| 2014 | $2,914 | $229,600 | $76,500 | $153,100 |
Source: Public Records
Map
Nearby Homes
- 1814 N Notting Hill Ln
- 3855 Harlan Ranch Blvd
- 3838 Moody Ln
- 3940 Chessa Ln
- 1638 N Mcpherson Ln
- 3664 Vermont Ln
- 3708 Richmond Ave
- 4153 Serena Ave
- 4226 Serena Ln
- 1609 N Piccadilly Ln
- 3560 Bloomfield Ln
- 3544 Prescott Ave
- 3531 Alcove Way
- 3482 Elevations Way
- 1742 N Broadbent Ln
- 1521 N Encoure Way
- 3396 Trenton Ave
- 8099 E Nees Ave
- 7747 E Nees Ave
- 1687 N Blackwood Ave
- 3977 Harlan Ranch Blvd
- 3971 Harlan Ranch Blvd
- 3984 Trenton Ave
- 3965 Harlan Ranch Blvd
- 3997 Harlan Ranch Blvd
- 3972 Trenton Ave
- 3991 Harlan Ranch Blvd
- 3998 Trenton Ave
- 3978 Trenton Ave
- 3966 Trenton Ave
- 3959 Harlan Ranch Blvd
- 3953 Harlan Ranch Blvd
- 3960 Trenton Ave
- 3954 Trenton Ave
- 3941 Harlan Ranch Blvd
- 3948 Trenton Ave
- 3991 Heritage Ave
- 3942 Trenton Ave
- 3958 Harlan Ranch Blvd
- 4005 Harlan Ranch Blvd
Your Personal Tour Guide
Ask me questions while you tour the home.